Users and Queries (Snowflake)
The Users and Queries sections provide information for assessing and optimizing the costs of your Snowflake environment. This section of the cost is further broken down into the User section and the Queries section.
The Queries section drills deeper into the cost aspects of query execution, enabling you to understand the cost impact of your query activities and optimize resource allocation.
Users (Cost)
The Users section helps you to understand the financial implications of user activity in Snowflake. By identifying high-cost users, you can allocate resources more efficiently and make data operations budget-conscious. You can monitor user costs over time to detect fluctuations and investigate users impacting your budget. You can also ensure that your expenses align with operational requirements.
Queries (Cost)
From the Unravel UI, click Cost. > Cost 360
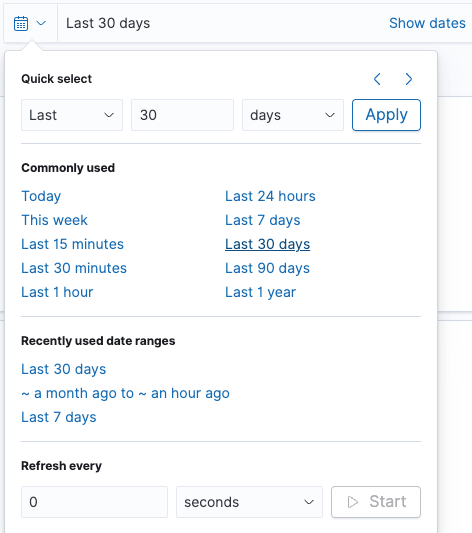
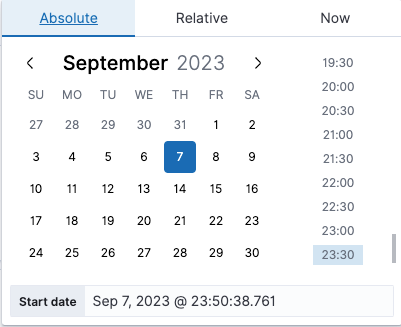
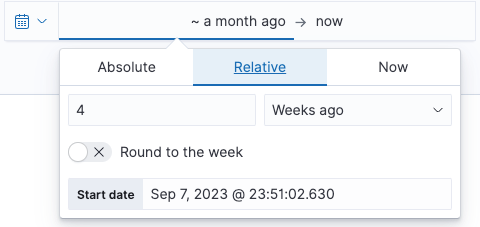
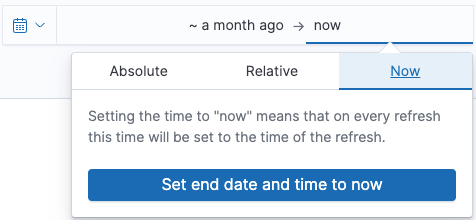
Filter the data using the date range or fields.
Scroll down to view the User and Queries section.
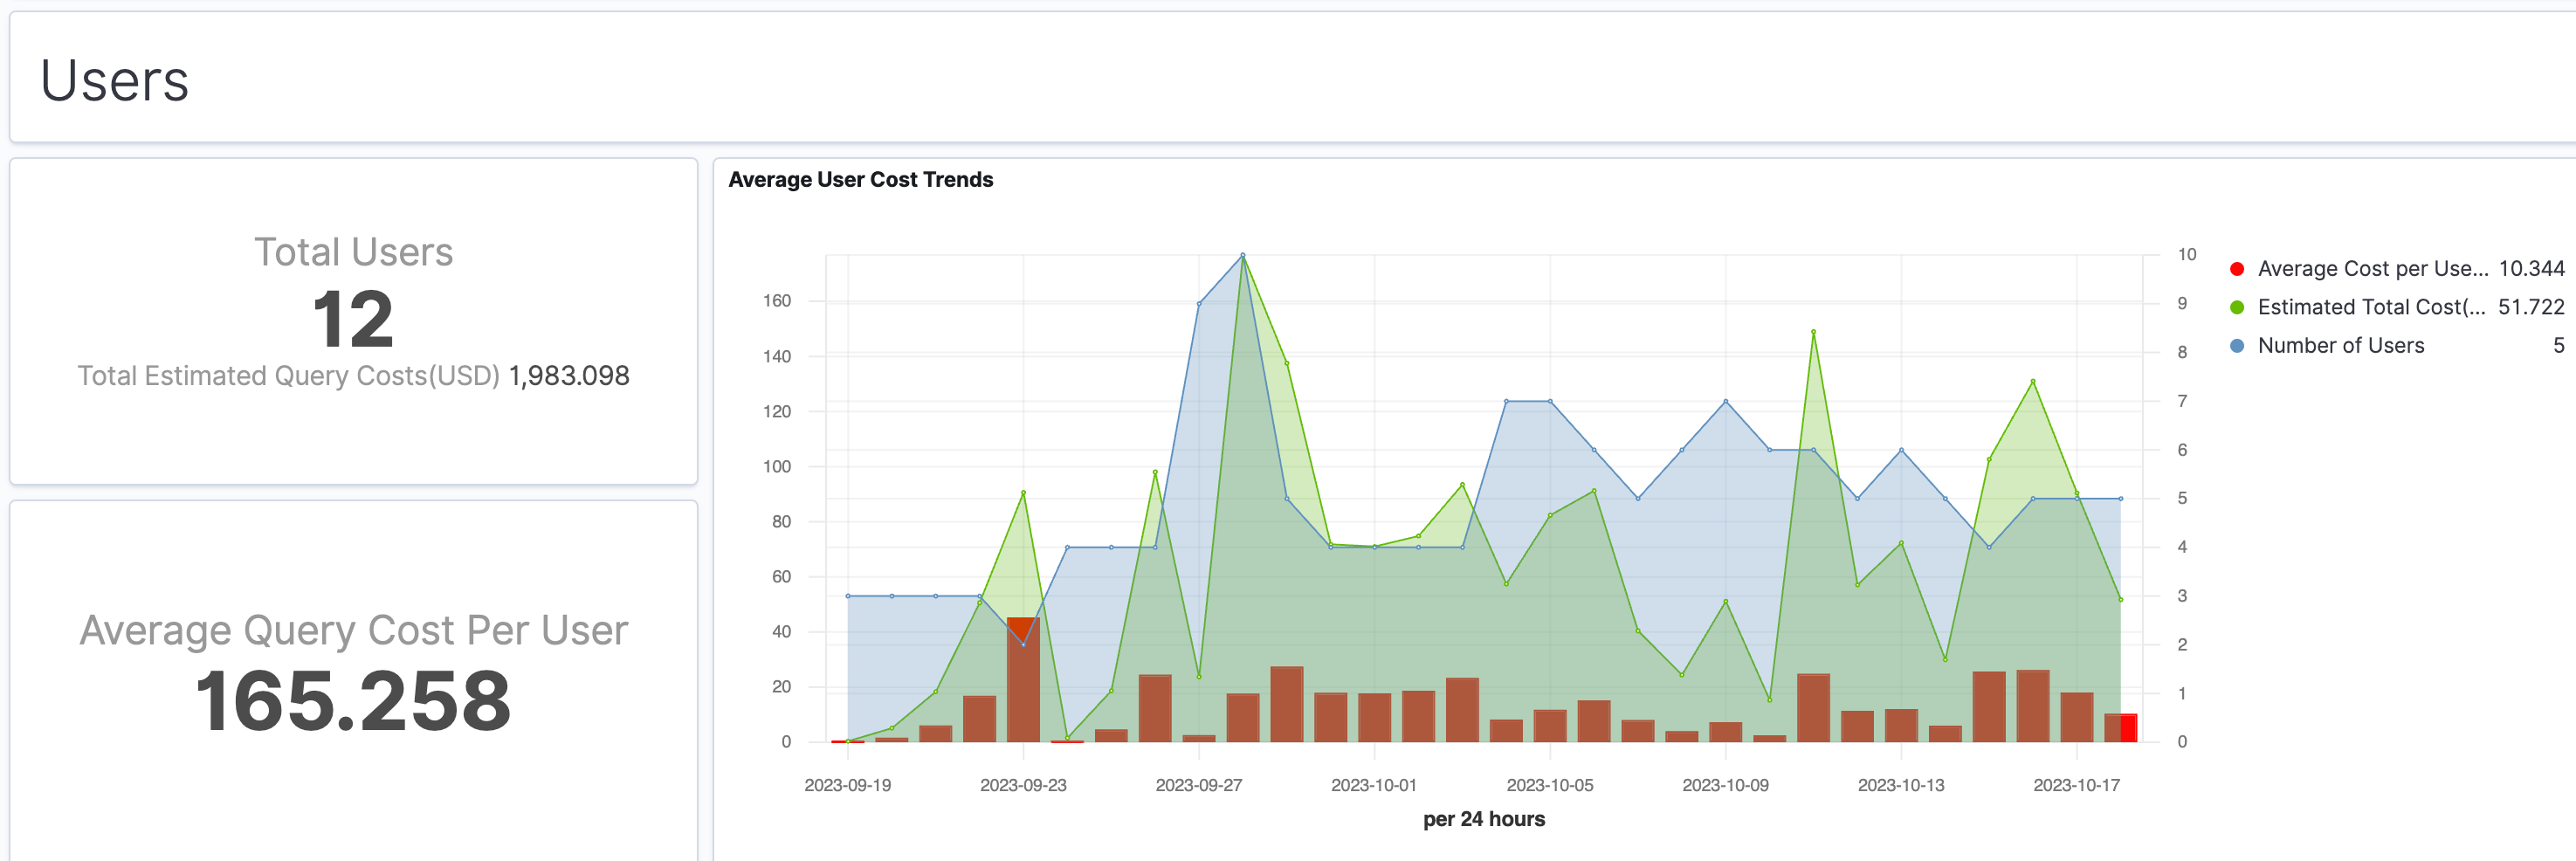
Users
The Total Users and Average Cost Per User is displayed along with a graph for Average User Cost. In the graph, you can filter for Average Cost per User, Estimated Total Cost, and Number of Users.
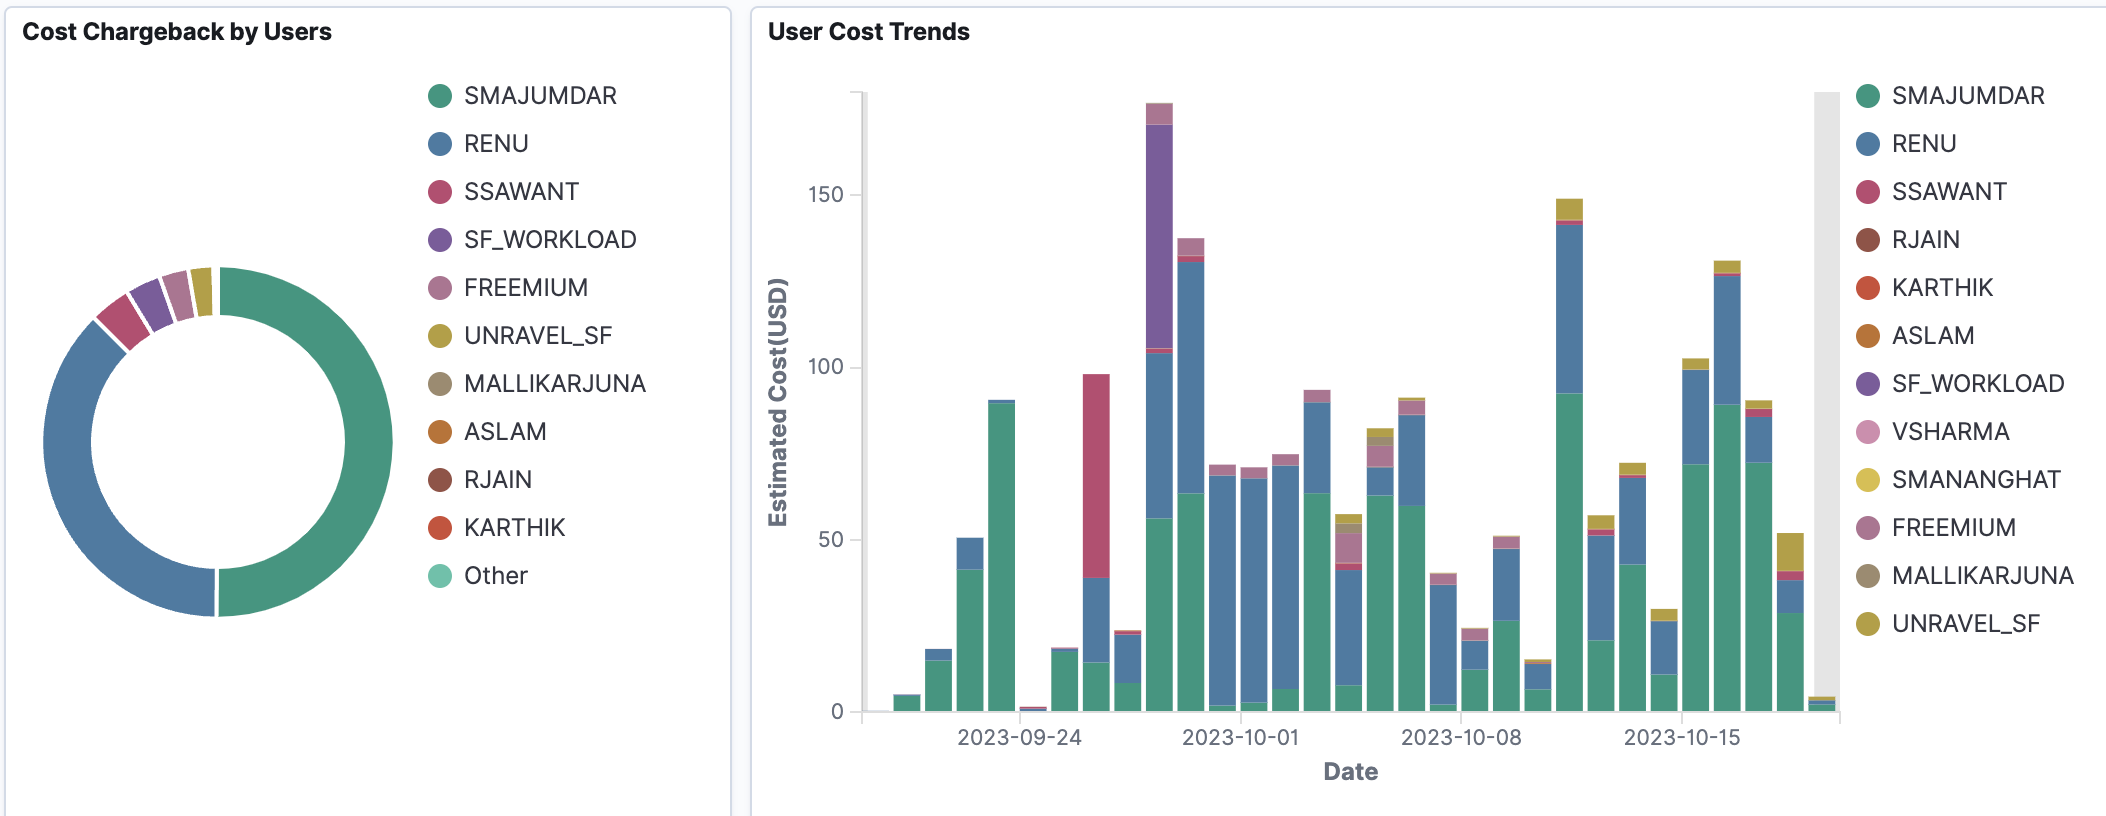
Filter for the required user in the Cost Chargeback by Users and User Cost Trends in the respective Pie Charts.
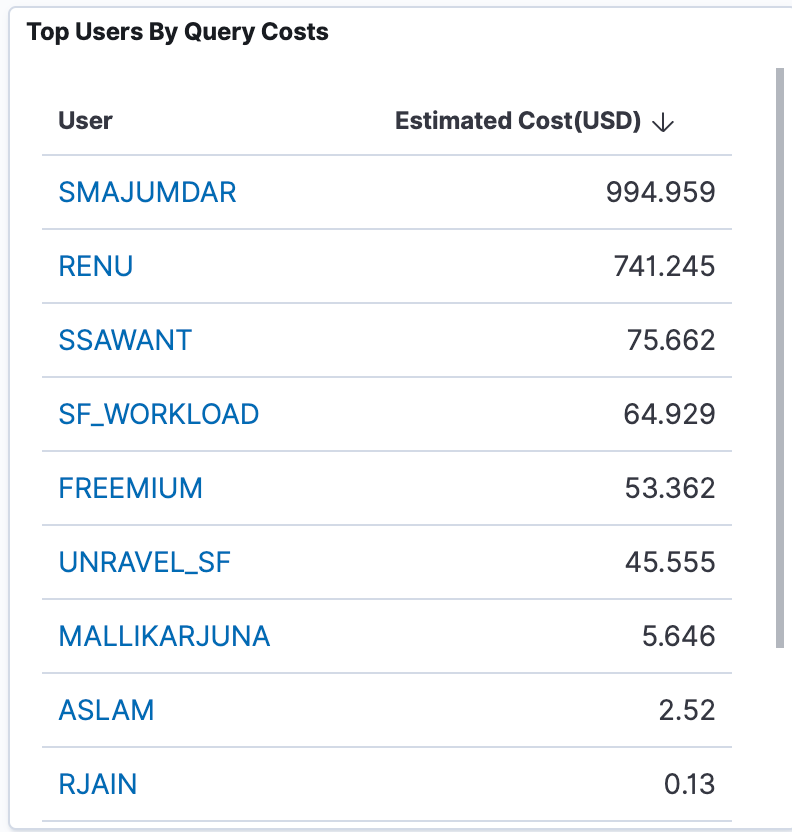
The Top Users by Query Costs is displayed as a list view. Filter for the required user to navigate to the Query page with the filters applied for the selected user.
Queries
View the Total Queries, Associated Costs, and Average Cost per User in this section. You can also filter for the Number of Queries and the Estimated Total Cost in the trends graph.

View the Most Expensive Query Signature and click the required query signature from the list to access the Query page with the selected query signature filter applied.

View the Cost Chargeback by Query Signatures and the Query Signature trends.

