Home page
The Home page provides a health check of your Snowflake environment. It gives you an overview of your usage, various types of inefficiencies that Unravel automatically discovers about cost and performance, recommendations to address these inefficiencies and their potential benefits, the progress of your team acting on these recommendations, and more.
Viewing the Home page
On the Unravel UI, navigate to Home.
From the top-right corner of the page, click Configure.
Select the lookback interval to generate the report. The daily report is updated once a day based on the workload over the past 7 or 14 days. You can select either 7 or 14 days.
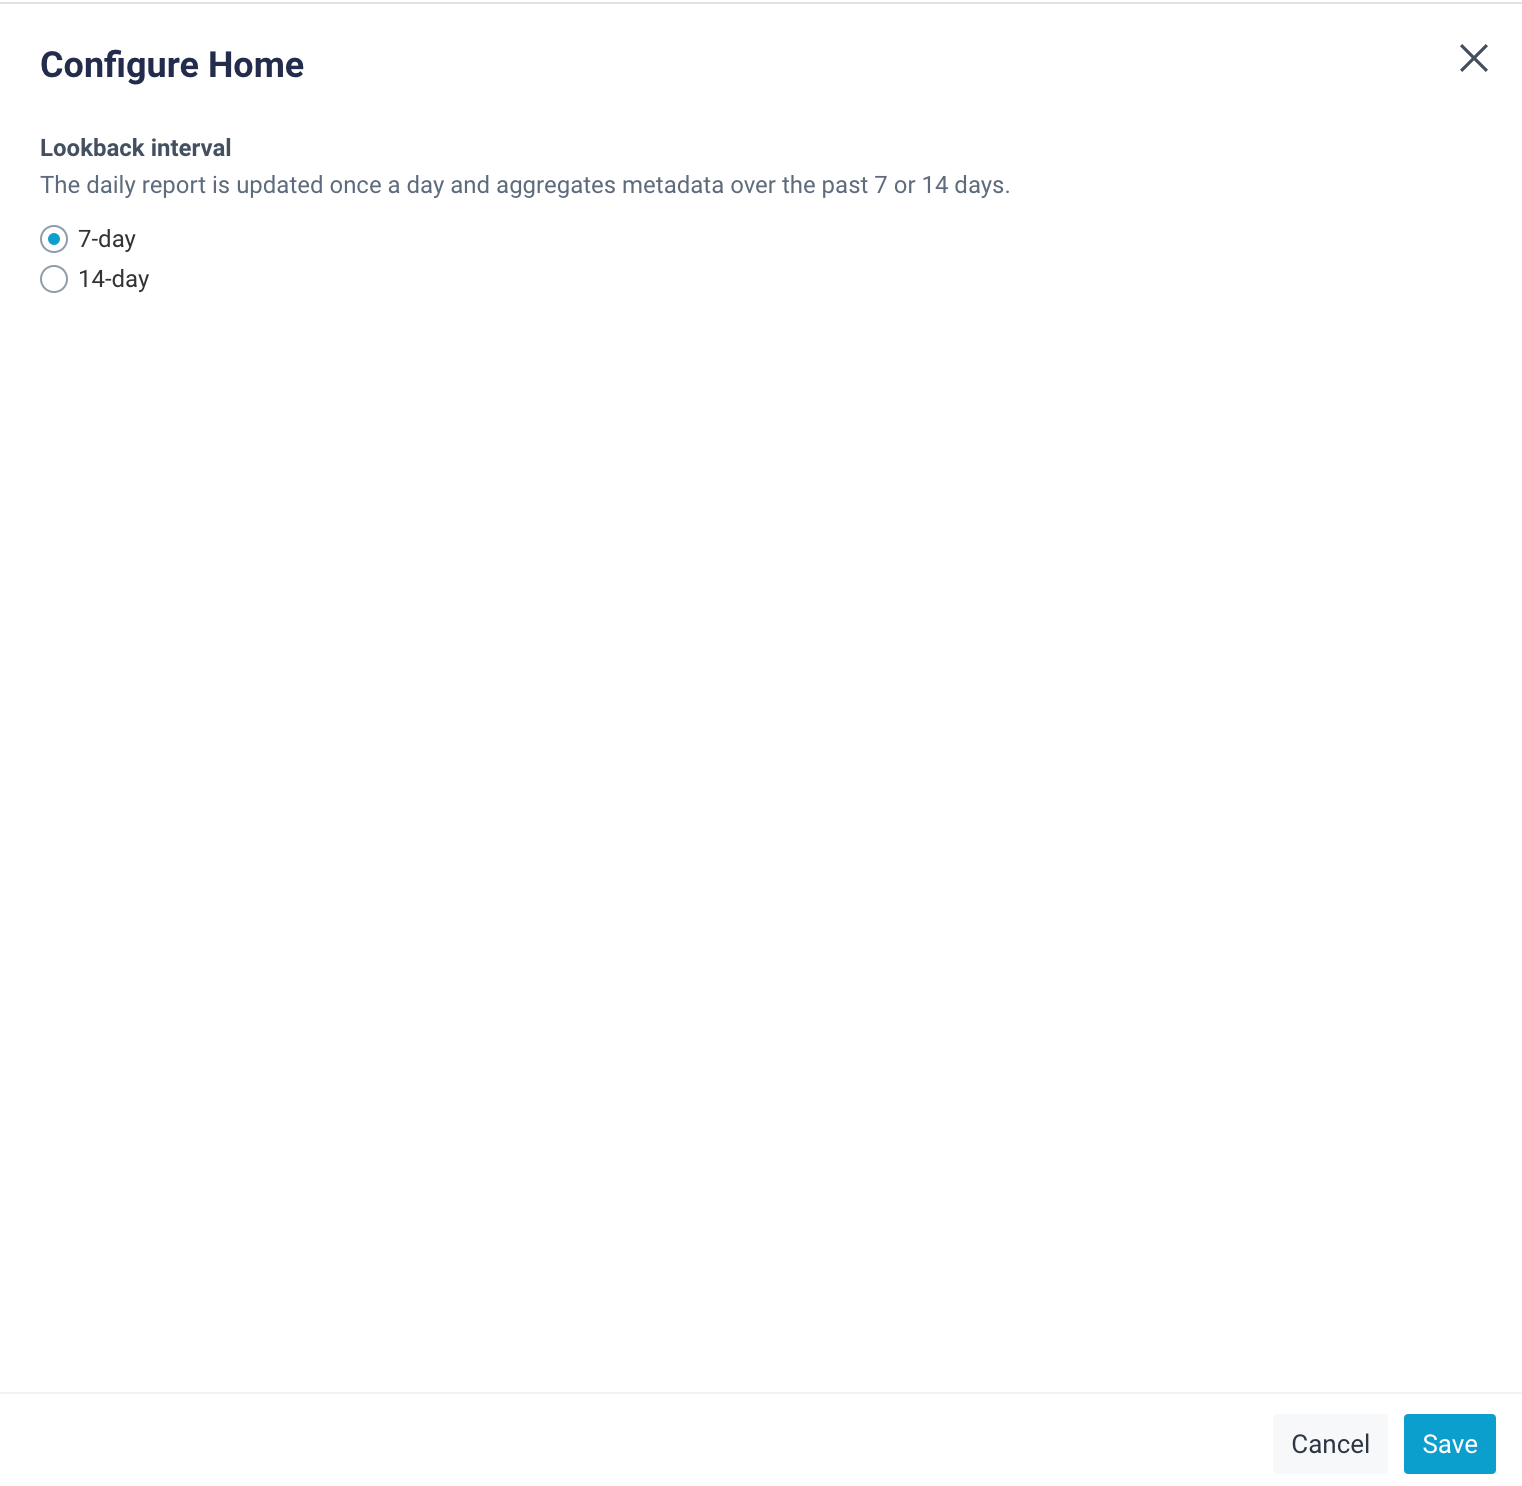
You can also select a date to view the history of the report generated previously. The latest report for the selected date is displayed.
The Home page has the following dashboards:
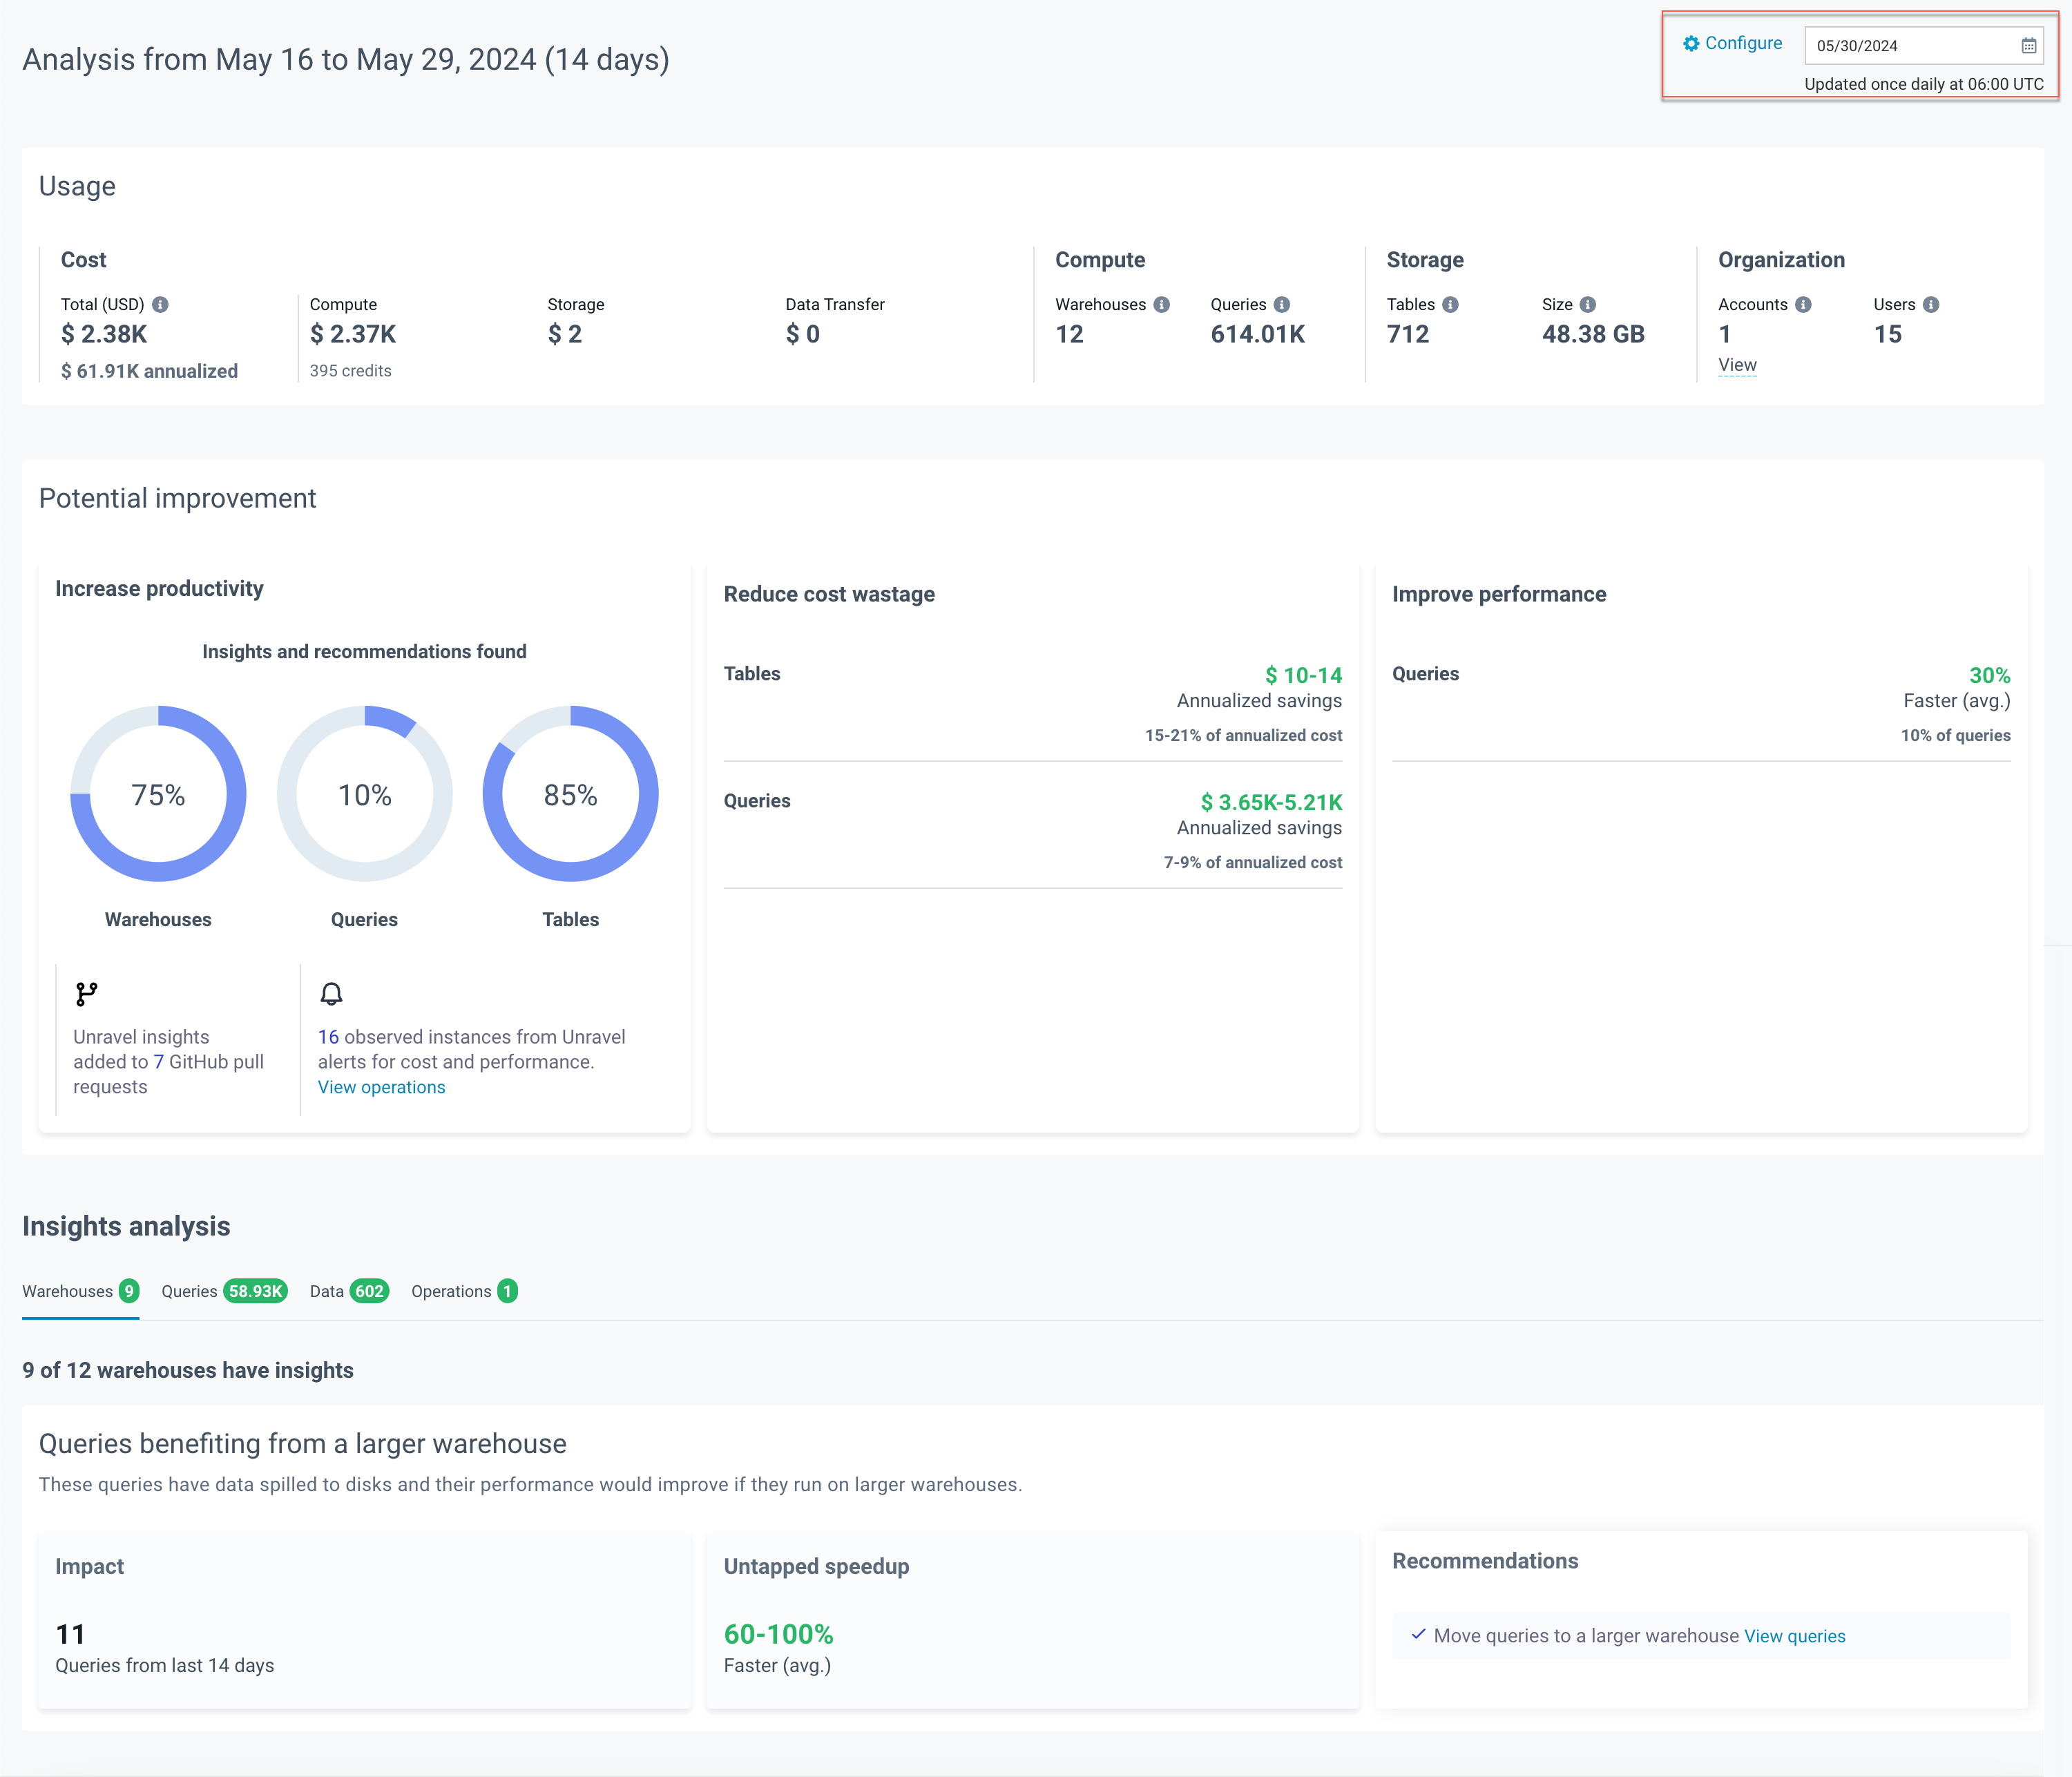
The Usage dashboard provides a snapshot of your Snowflake usage over the selected reporting period. See how much you pay for usage, including compute, storage, and data transfer costs.
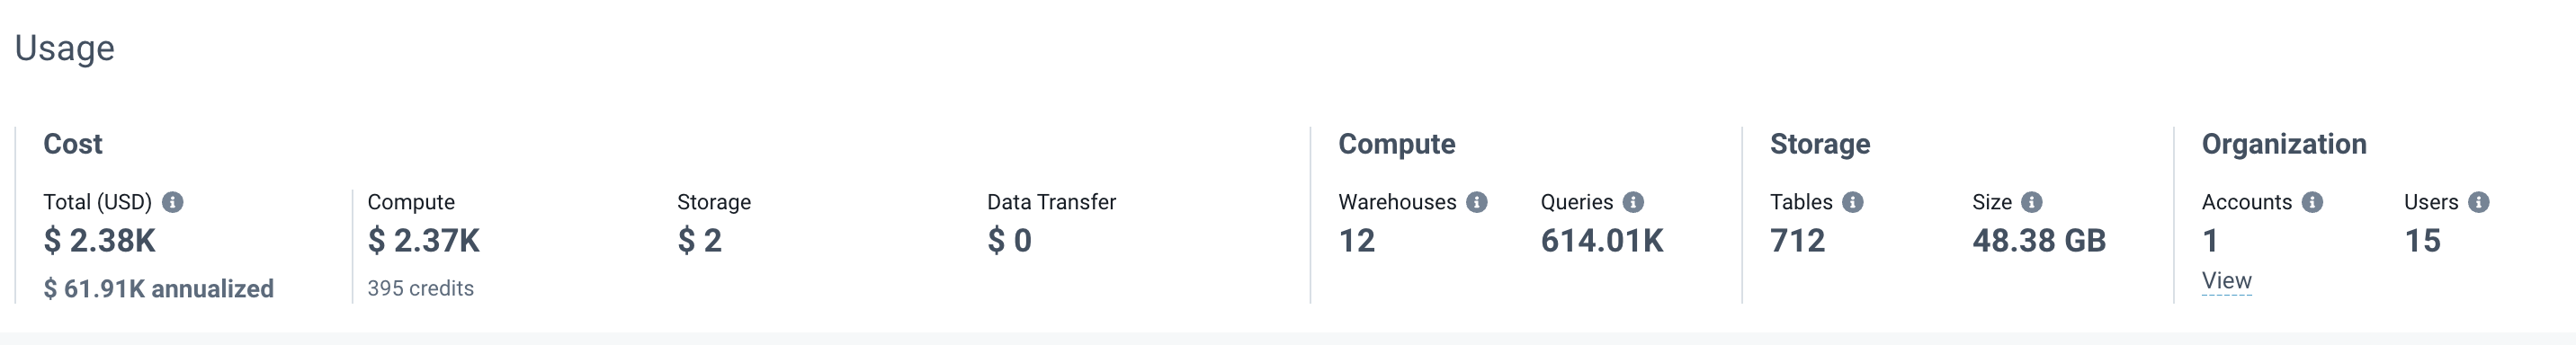
You get a clear understanding of your costs and their breakdown here. The Total Cost and Annualized Cost provide insights into your spending patterns and projected annual expenses. The Cost Breakdown clarifies how much you spend on compute, storage, and data transfer, and the details on compute, storage, and organization help you understand the specific components contributing to your costs.
You can find the following details in this dashboard:
Total Cost: View the combined cost of compute, storage, and data transfer for the selected time period.
Annualized Cost: Find the estimated yearly cost based on the total cost for the selected time period. It’s calculated as: Annualized Cost=(Total Cost/Configured Time Period)×365
This projects your annual cost based on your spending during the selected period.
Cost Breakdown
Compute: Cost based on the total number of warehouses and queries.
Storage: Costs for storing data, determined by the total number of tables and their sizes.
Data Transfer: Costs for transferring data in and out.
Compute
Warehouses: The total number of warehouses seen in this period.
Queries: The total number of queries processed in this period.
Storage
Tables: The total number of tables seen during this period.
Size: The average storage size per day during this period.
Organization
Accounts: The total number of Snowflake accounts monitored by Unravel.
Users: The total number of users across all accounts during this period.
The Potential Improvements section highlights the areas where Unravel can enhance your system's performance, productivity, and cost efficiency. By automatically identifying problems and providing actionable insights, Unravel helps you optimize your usage of Snowflake. It guides you in making informed decisions to maximize efficiency and save resources.
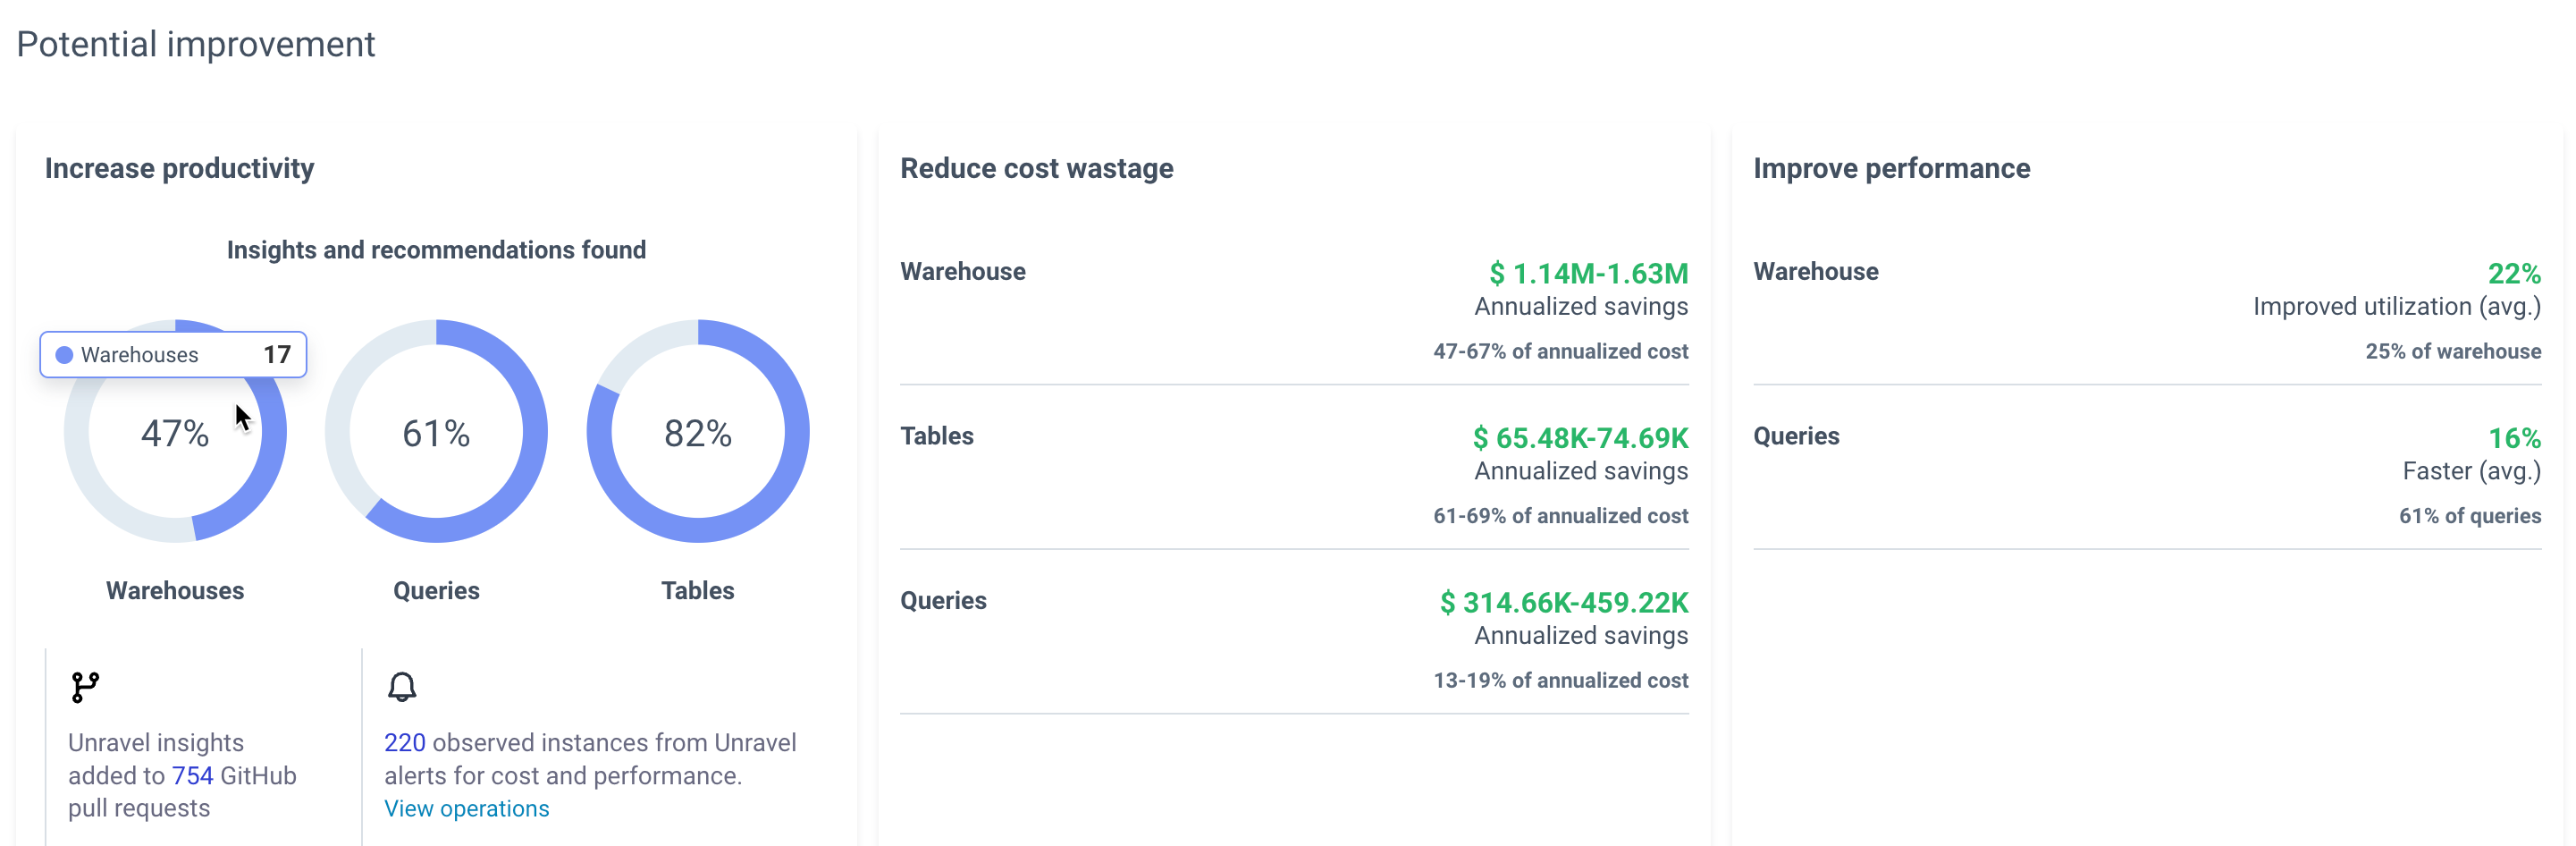
This section automatically identifies and highlights inefficiencies and problems across your warehouses, queries, and tables. It provides immediate insights and recommendations, reducing the time you spend discovering and diagnosing issues.
Warehouses: Displays the percentage of warehouses with insights. Hover to find the total number of warehouses with insights.
Queries: Displays the percentage of queries with insights. Hover to find the total number of queries with insights during this period.
Tables: Displays the percentage of tables with insights. Hover to find the total number of tables with insights during this period.
GitHub Pull Requests: Indicates the number of GitHub pull requests with Unravel insights.
Unravel Alerts: Displays the number of instances from Unravel alerts for cost and performance.
This section shows the total cost and the percentage of annualized savings you could achieve by acting on Unravel's insights for warehouses, tables, and queries. You can see the potential annualized savings and understand how much percentage of your annualized cost these savings represent. The Reduce Cost Wastage highlights areas where you can save costs based on Unravel’s insights, providing estimated savings and showing how these savings impact your overall annual costs.
Warehouses: Estimated annualized savings and the percentage of annualized cost savings for warehouses that can be obtained by acting on the Unravel insights.
Tables: Estimated annualized savings and the percentage of annualized cost savings for tables that can be obtained by acting on the Unravel insights.
Queries: Estimated annualized savings and the percentage of annualized cost savings for queries that can be obtained by acting on the Unravel insights.
This section focuses on optimizing warehouse utilization and queries. It shows how efficiently resources are used and highlights underutilized resources. This helps you identify opportunities to improve resource utilization and query performance.
Warehouses: Percentage of warehouses with potential to improve utilization.
Queries: Percentage of queries with potential for faster execution.
The insight analysis section provides insights on the warehouse underutilization and recommendations, queries, insights, data, and operations.
This section helps you identify underutilized warehouses and provides actionable insights to optimize warehouse sizes. It also recommends adjustments to warehouse clusters to either reduce cost wastage or improve query performance, ensuring efficient resource utilization in your Snowflake environment.
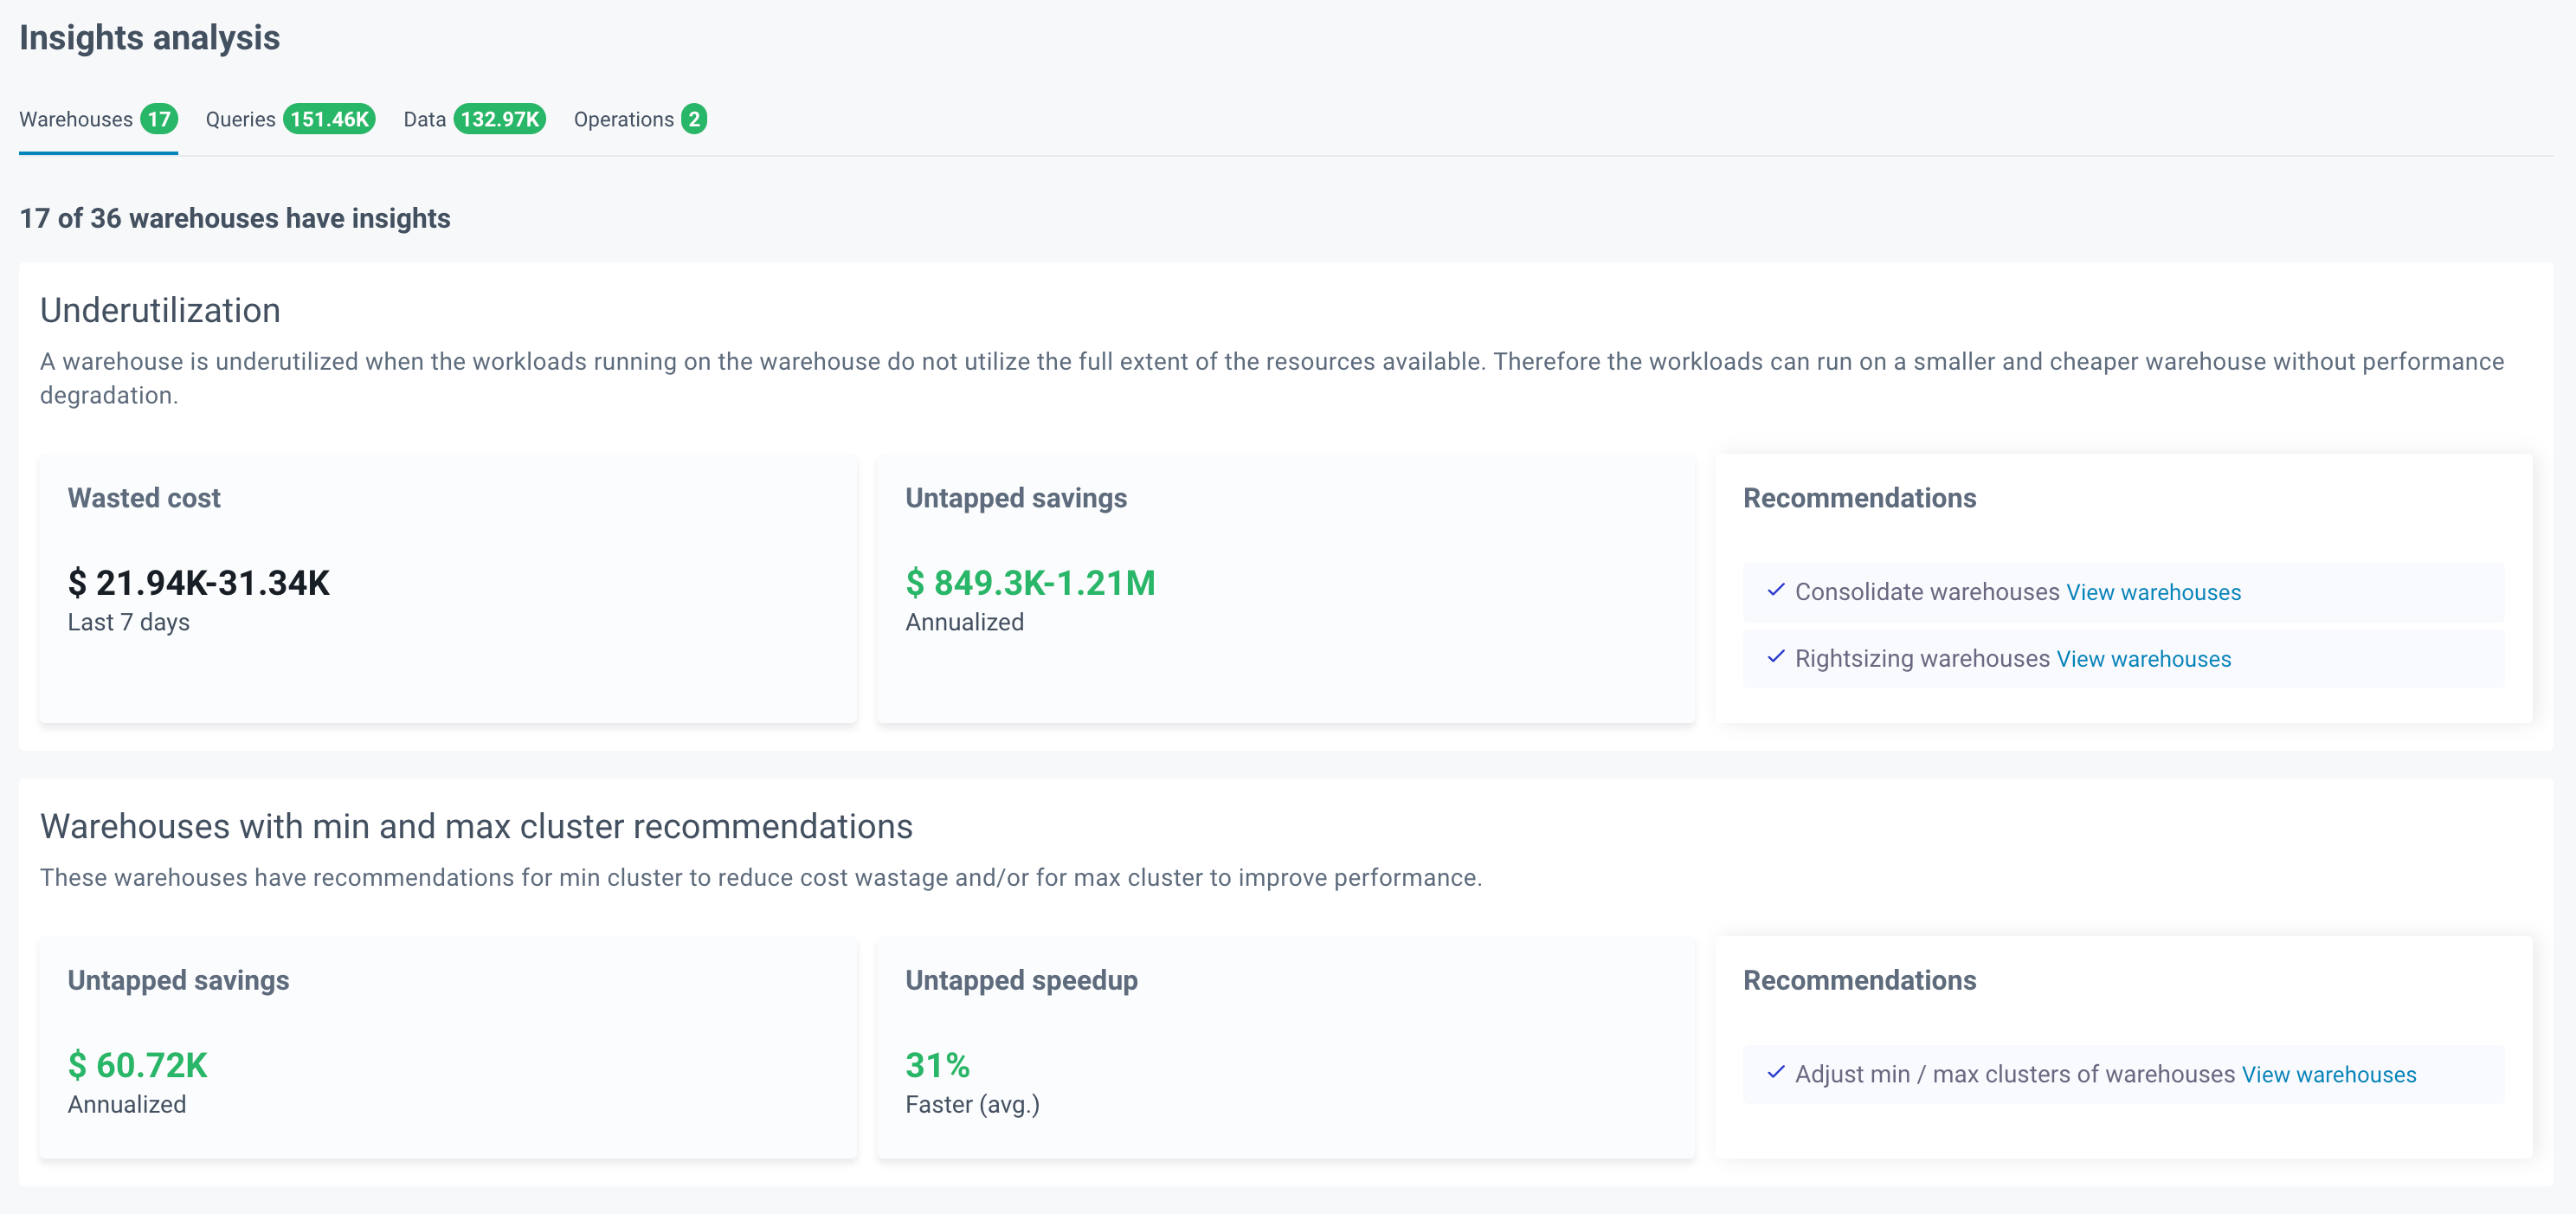
Underutilization: A warehouse is underutilized when the workloads running on it do not utilize the full extent of the resources available. Therefore, the workloads can run on a smaller and cheaper warehouse without performance degradation.
Wasted Cost: The estimated cost wasted due to underutilization.
Untapped Annualized Savings: Potential annualized savings if the warehouse is downsized to a more appropriate size.
Recommendations: Specific recommendations to optimize warehouse size and reduce cost without impacting performance. For more details on rightsizing warehouses see here.
Warehouses with Min and Max Cluster Recommendations: These warehouses have recommendations for a minimum cluster to reduce cost wastage and/or a maximum cluster to improve performance.
Untapped Annualized Savings: Potential annualized savings if downsizing recommendations are implemented.
Untapped Speedup Percentage: Potential performance improvement percentage if upsizing recommendations are implemented.
Recommendations: Specific suggestions to adjust warehouse size for optimal cost-efficiency or performance enhancement.
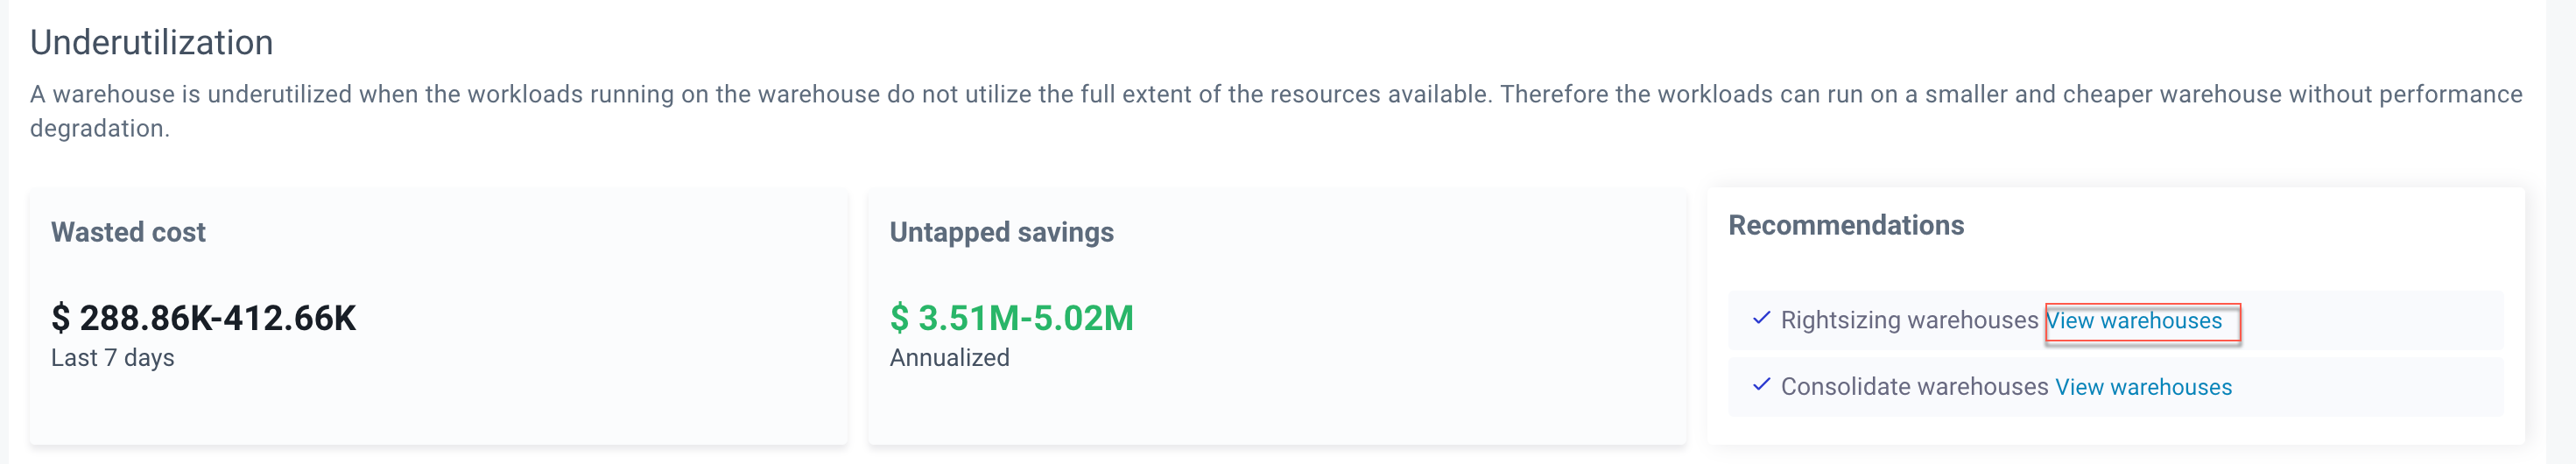
Warehouse rightsizing allows you to optimize resource utilization and reduce costs by adjusting warehouse configurations based on usage patterns.
To rightsize a warehouse
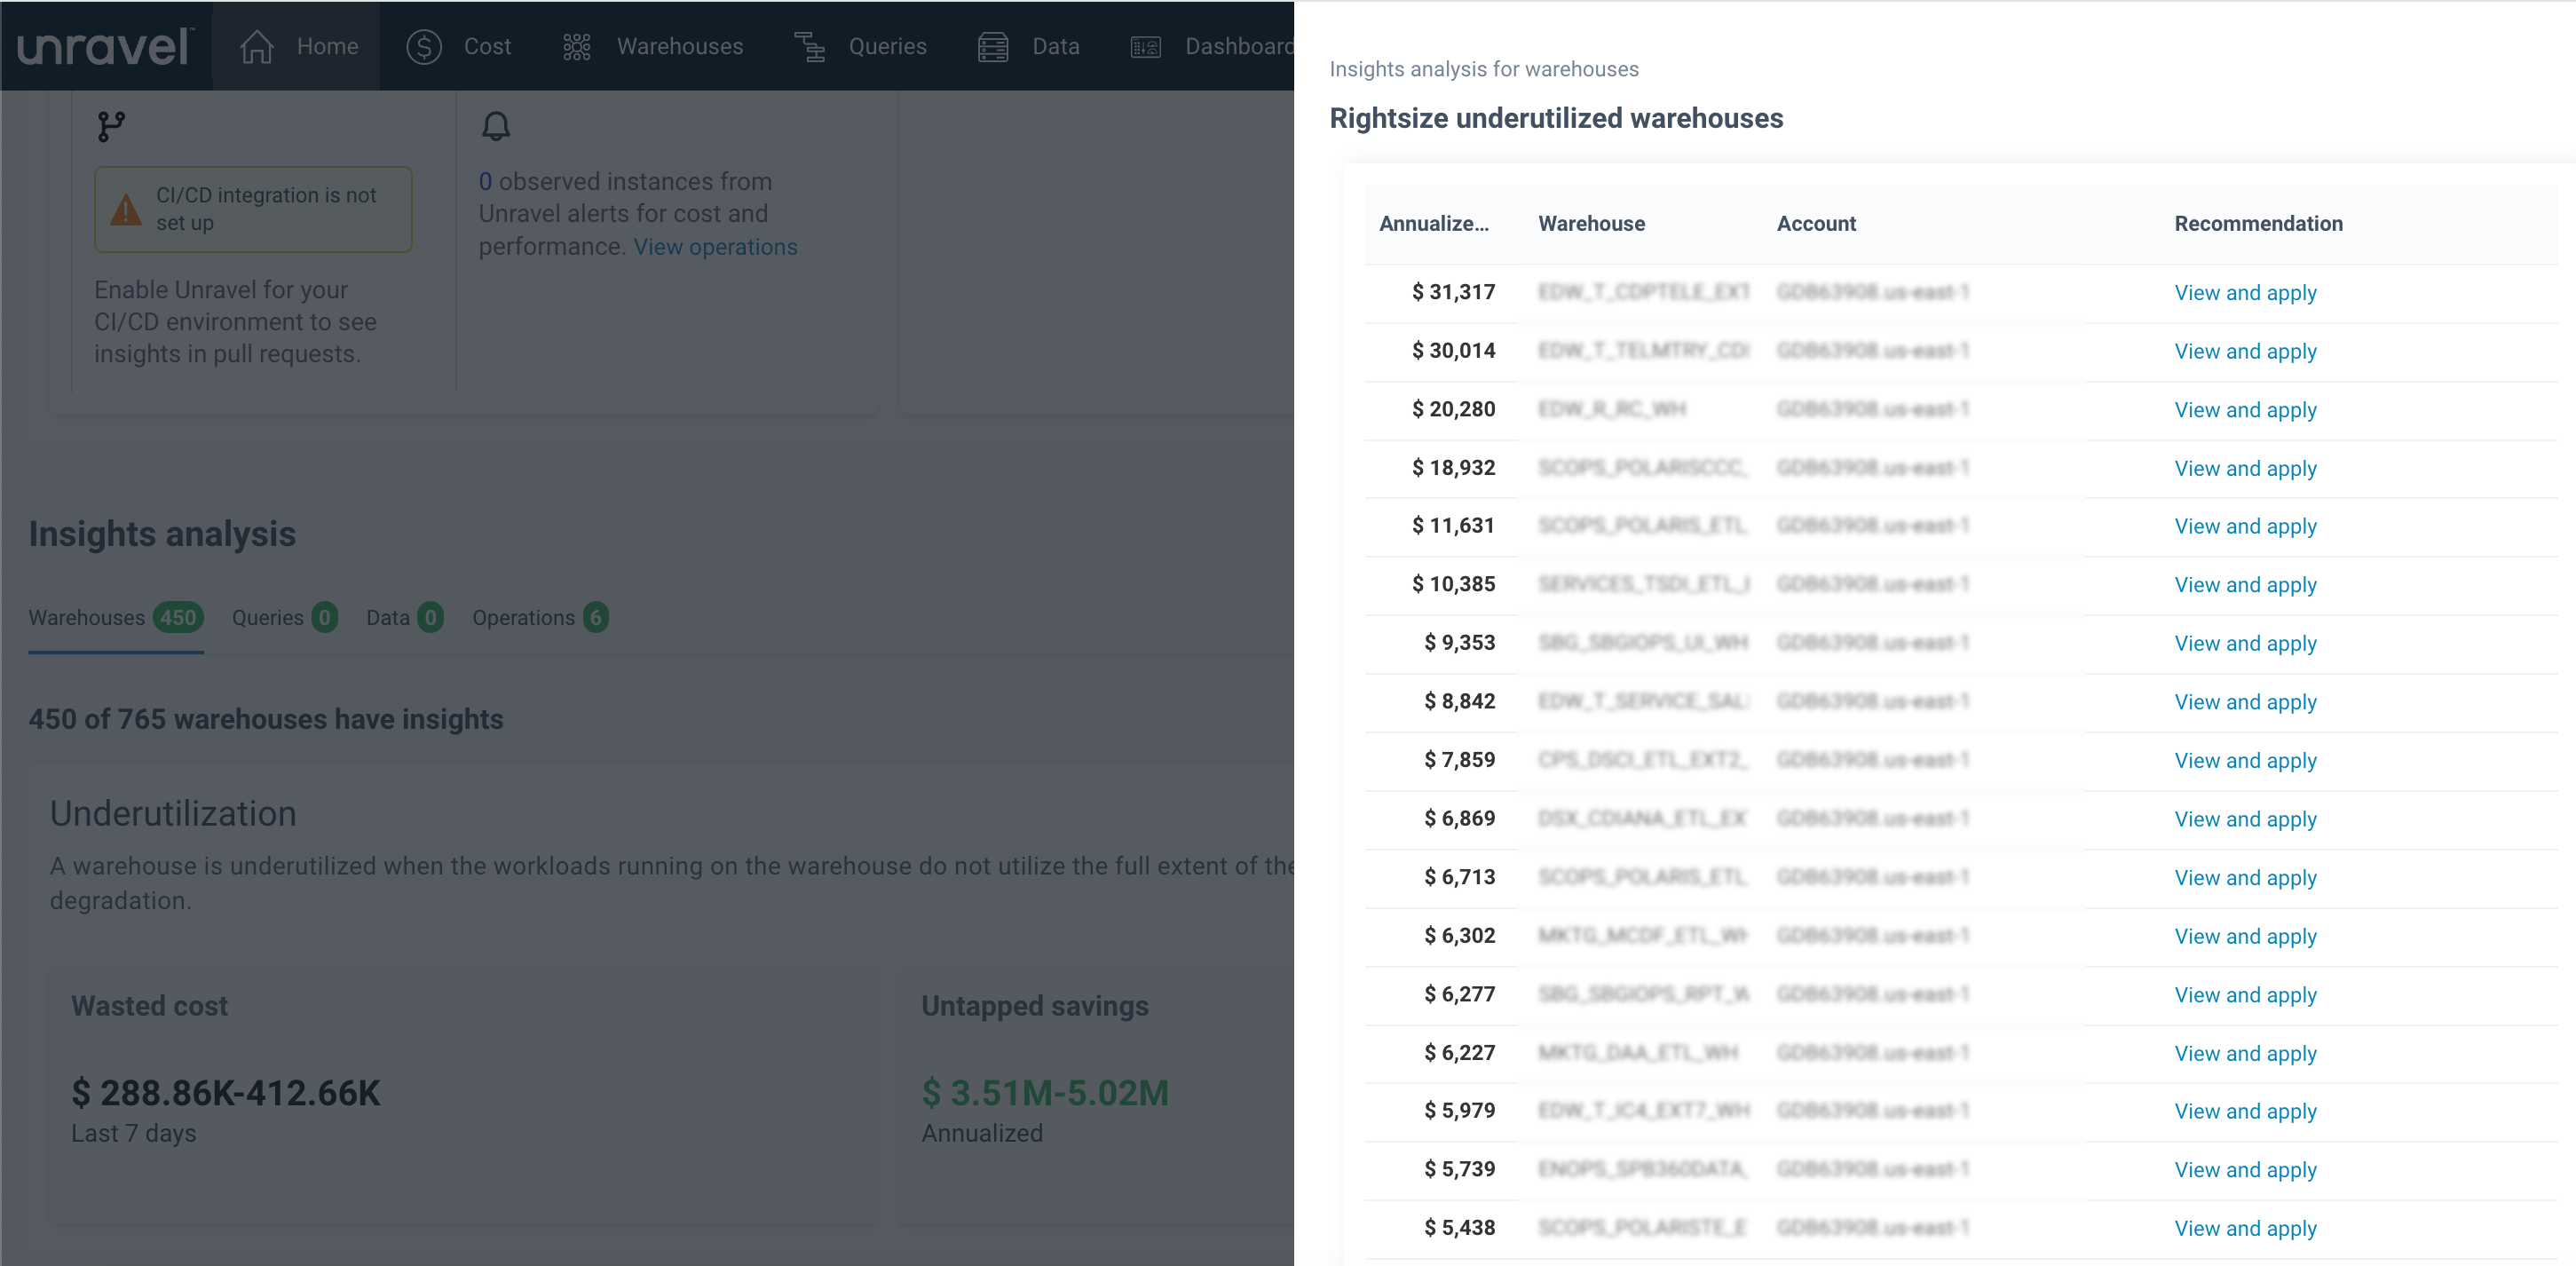
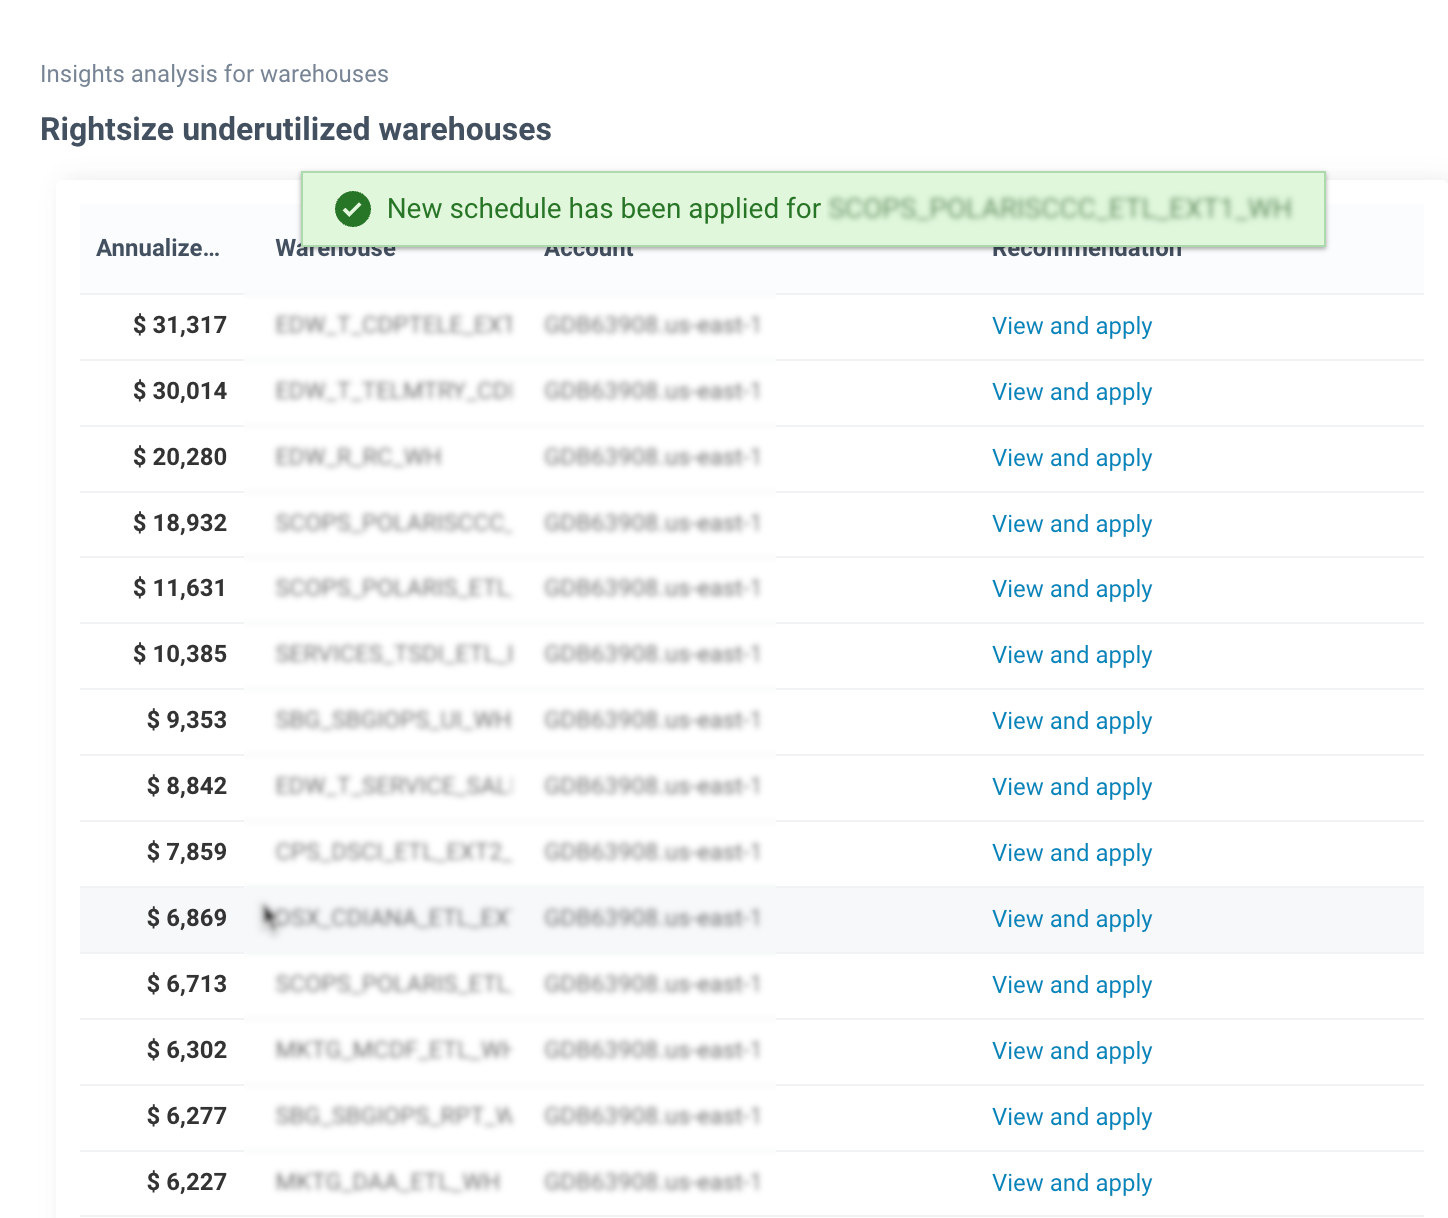
Click View Warehouses beside the Rightsizing Warehouses recommendation. The underutilized warehouses with rightsizing insight are displayed.
Click View and Apply beside the warehouse that you want to rightsize. The recommended warehouse configuration schedule is displayed.
Under the Schedule tab, review the recurring weekly schedule of the sizing recommendation for the warehouse. Click Code to view the schedule code. You can download the code from the Code tab.
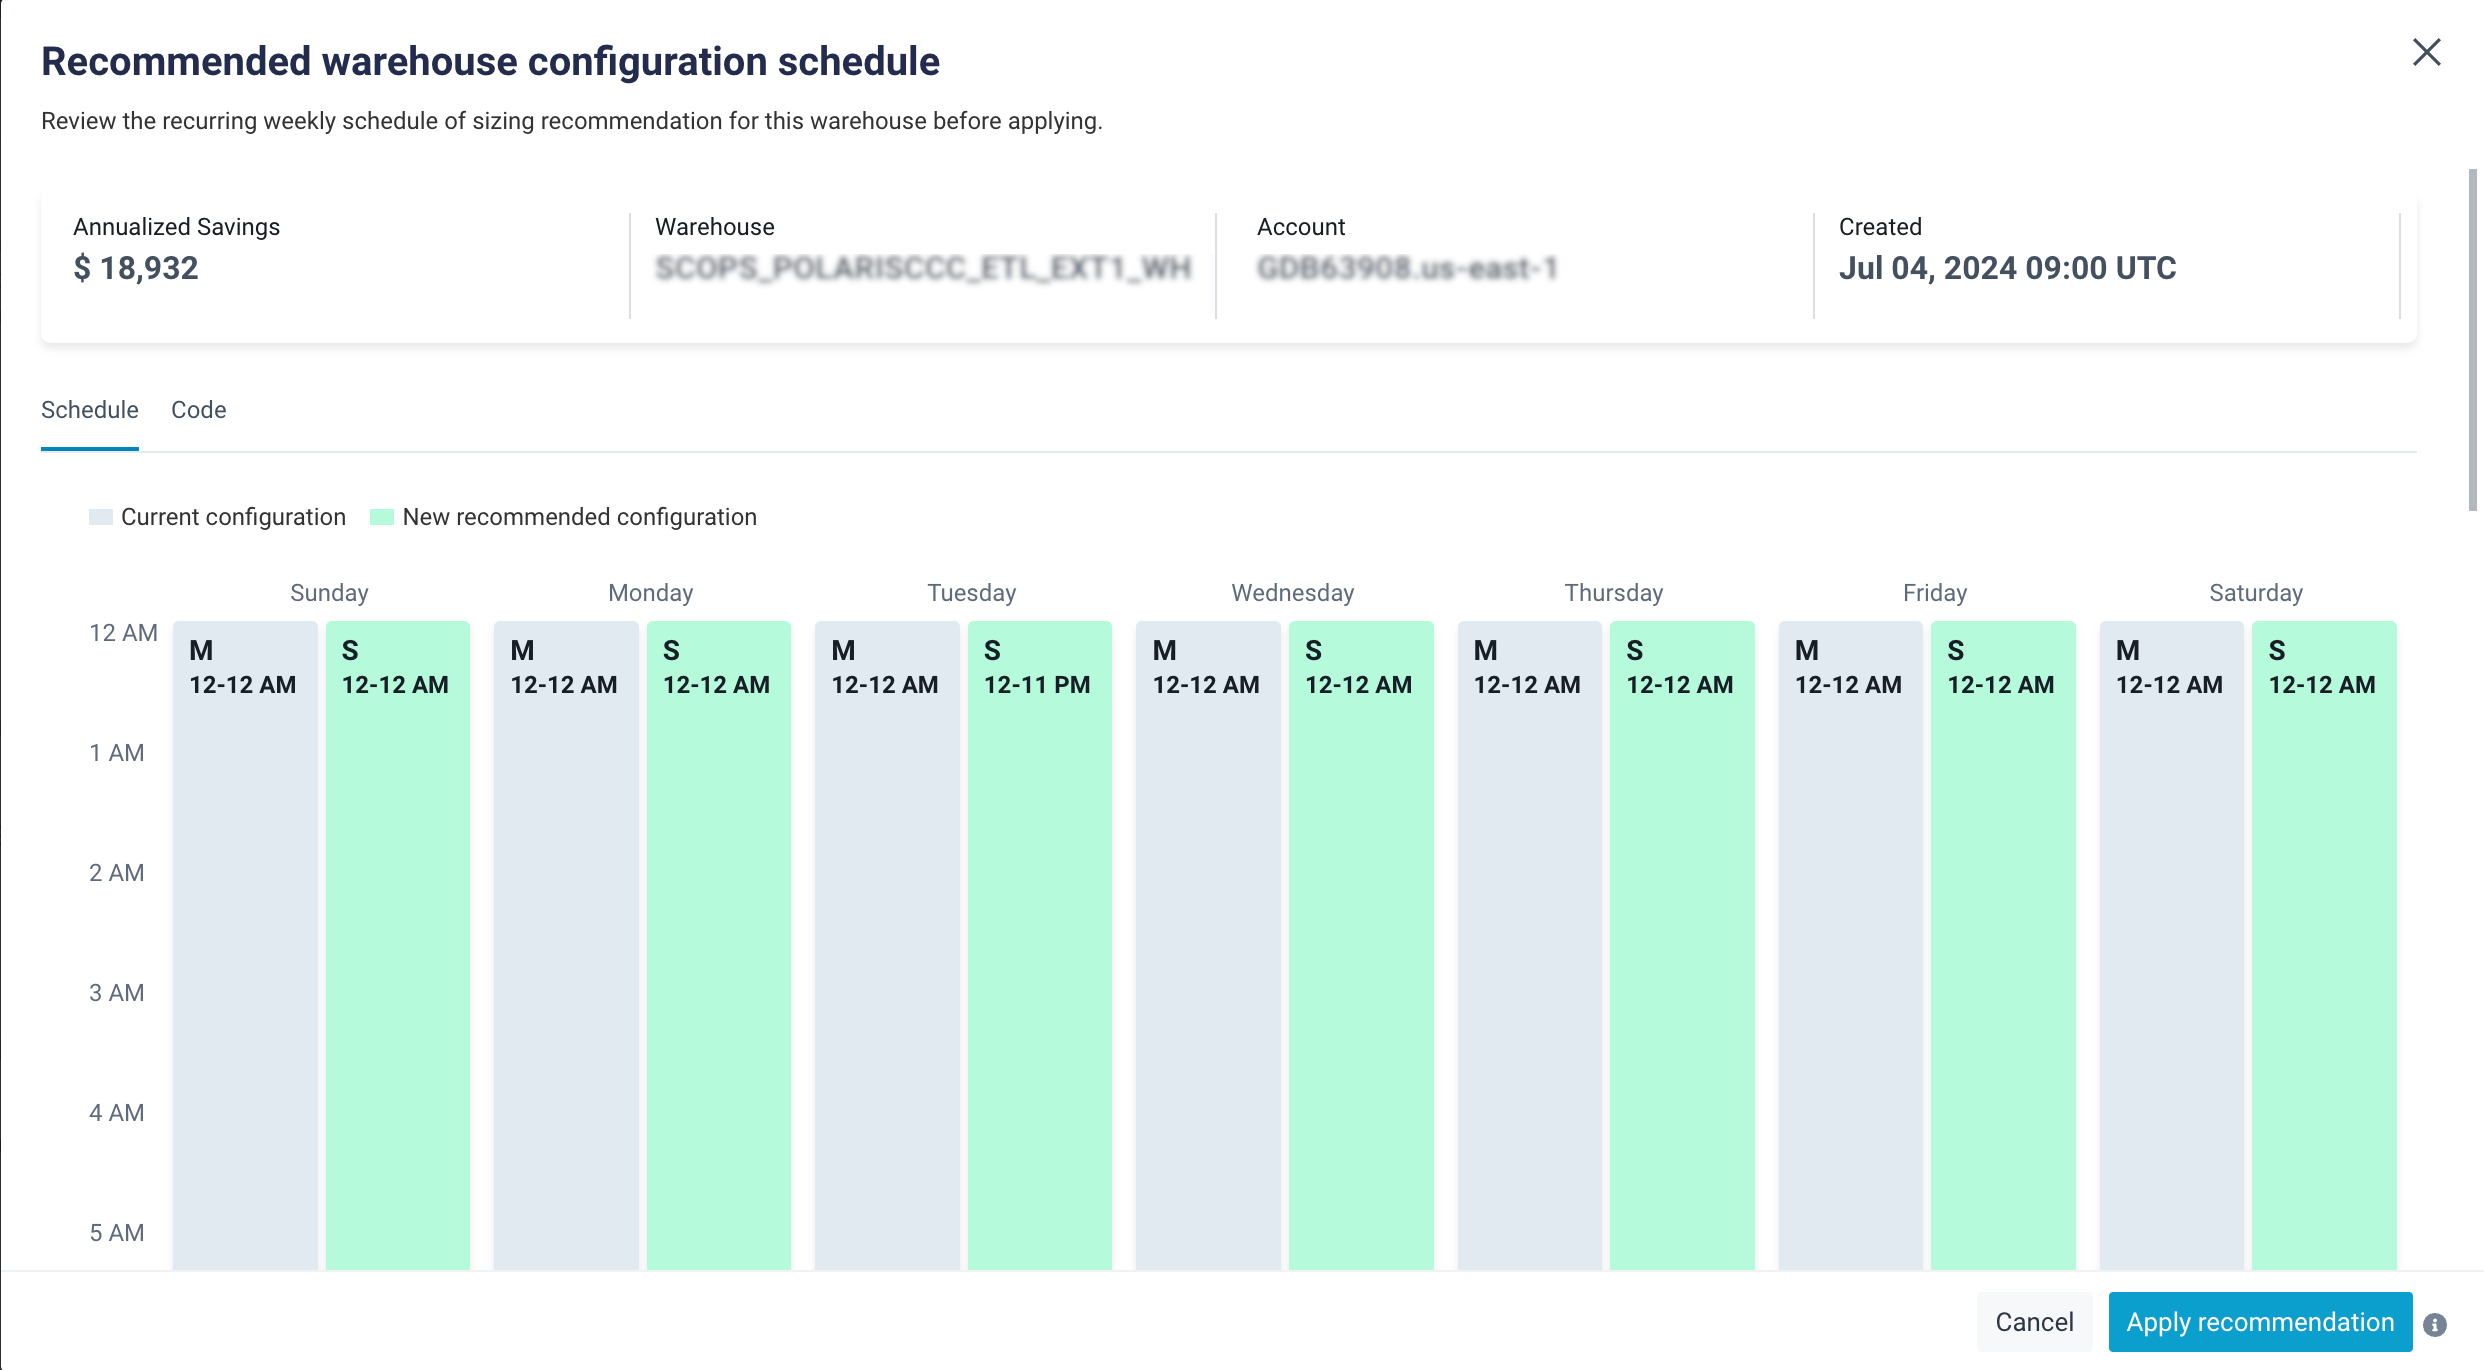
Click Apply Recommendation and click Confirm in the pop up window to apply the recommendation.

You will get a confirmation message for the applied recommendation in the Recommended Warehouse Configuration Schedule window.
Repeat the steps to right-size other warehouses.
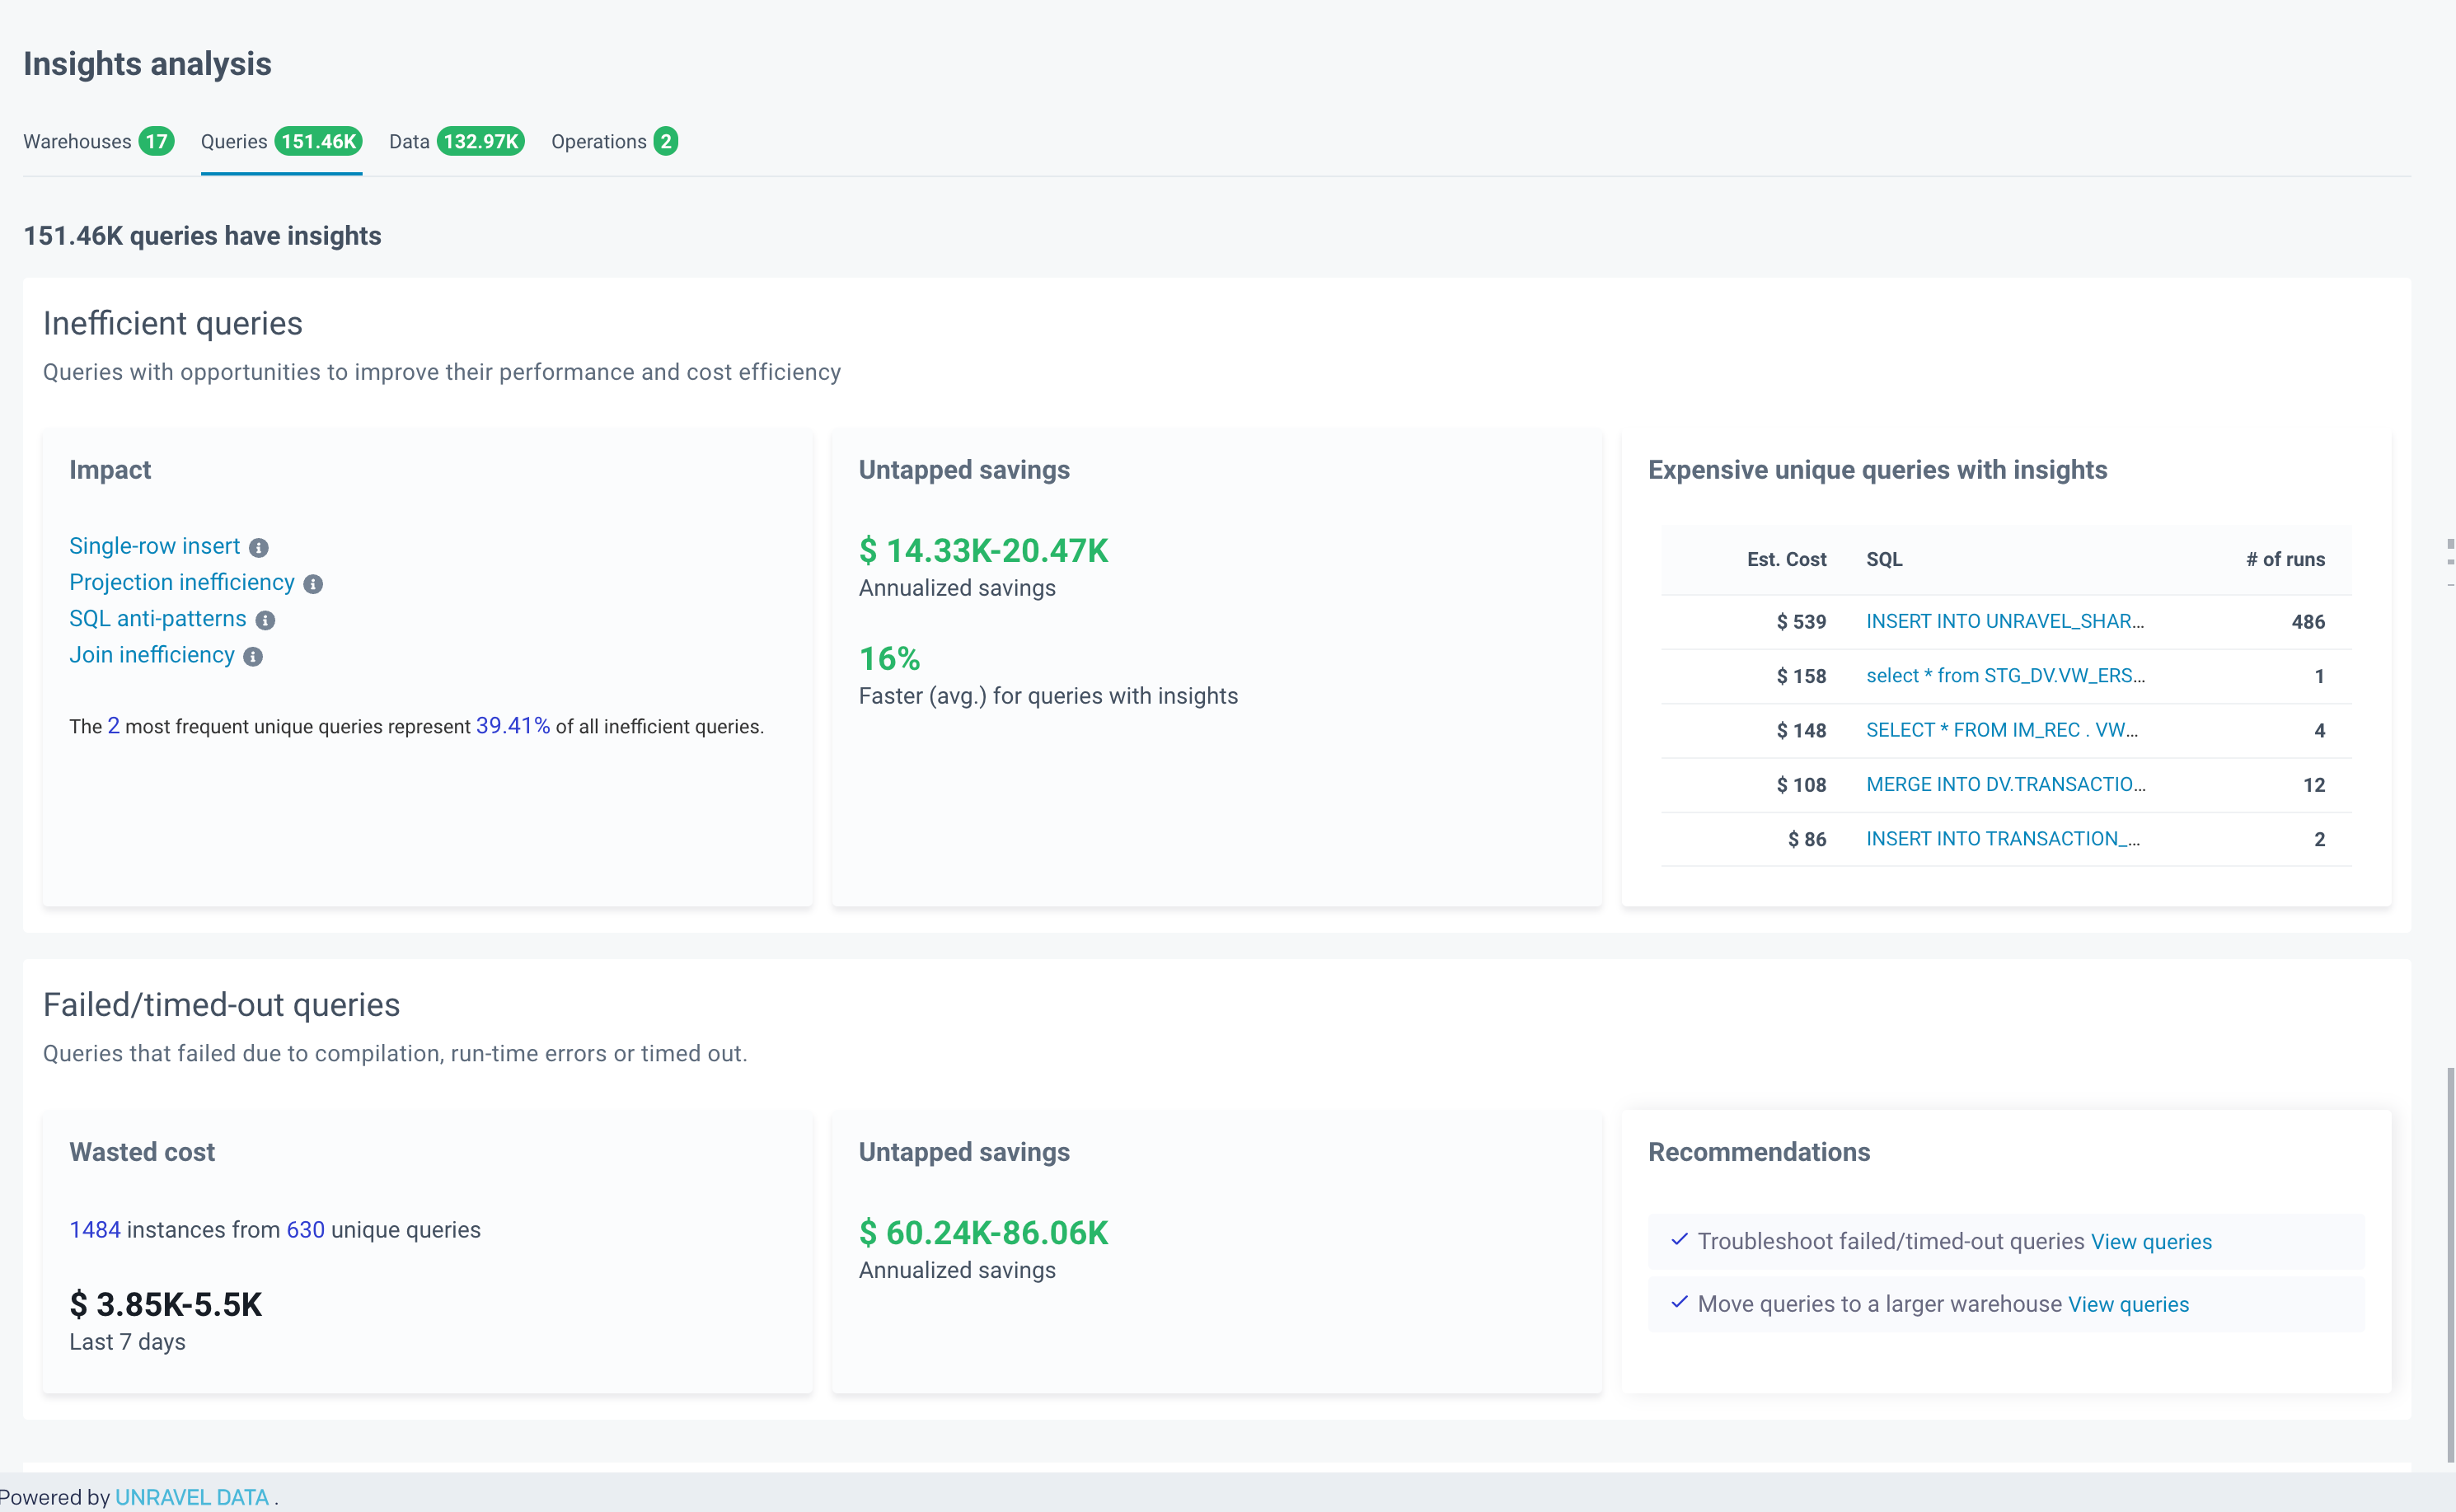
This dashboard highlights inefficient queries and their insights. Review the inefficient queries, potential untapped savings by acting on the insights, and expensive unique queries with insights. You can also view Failed/timed-out queries, their insights, and wasted costs and untapped savings value.
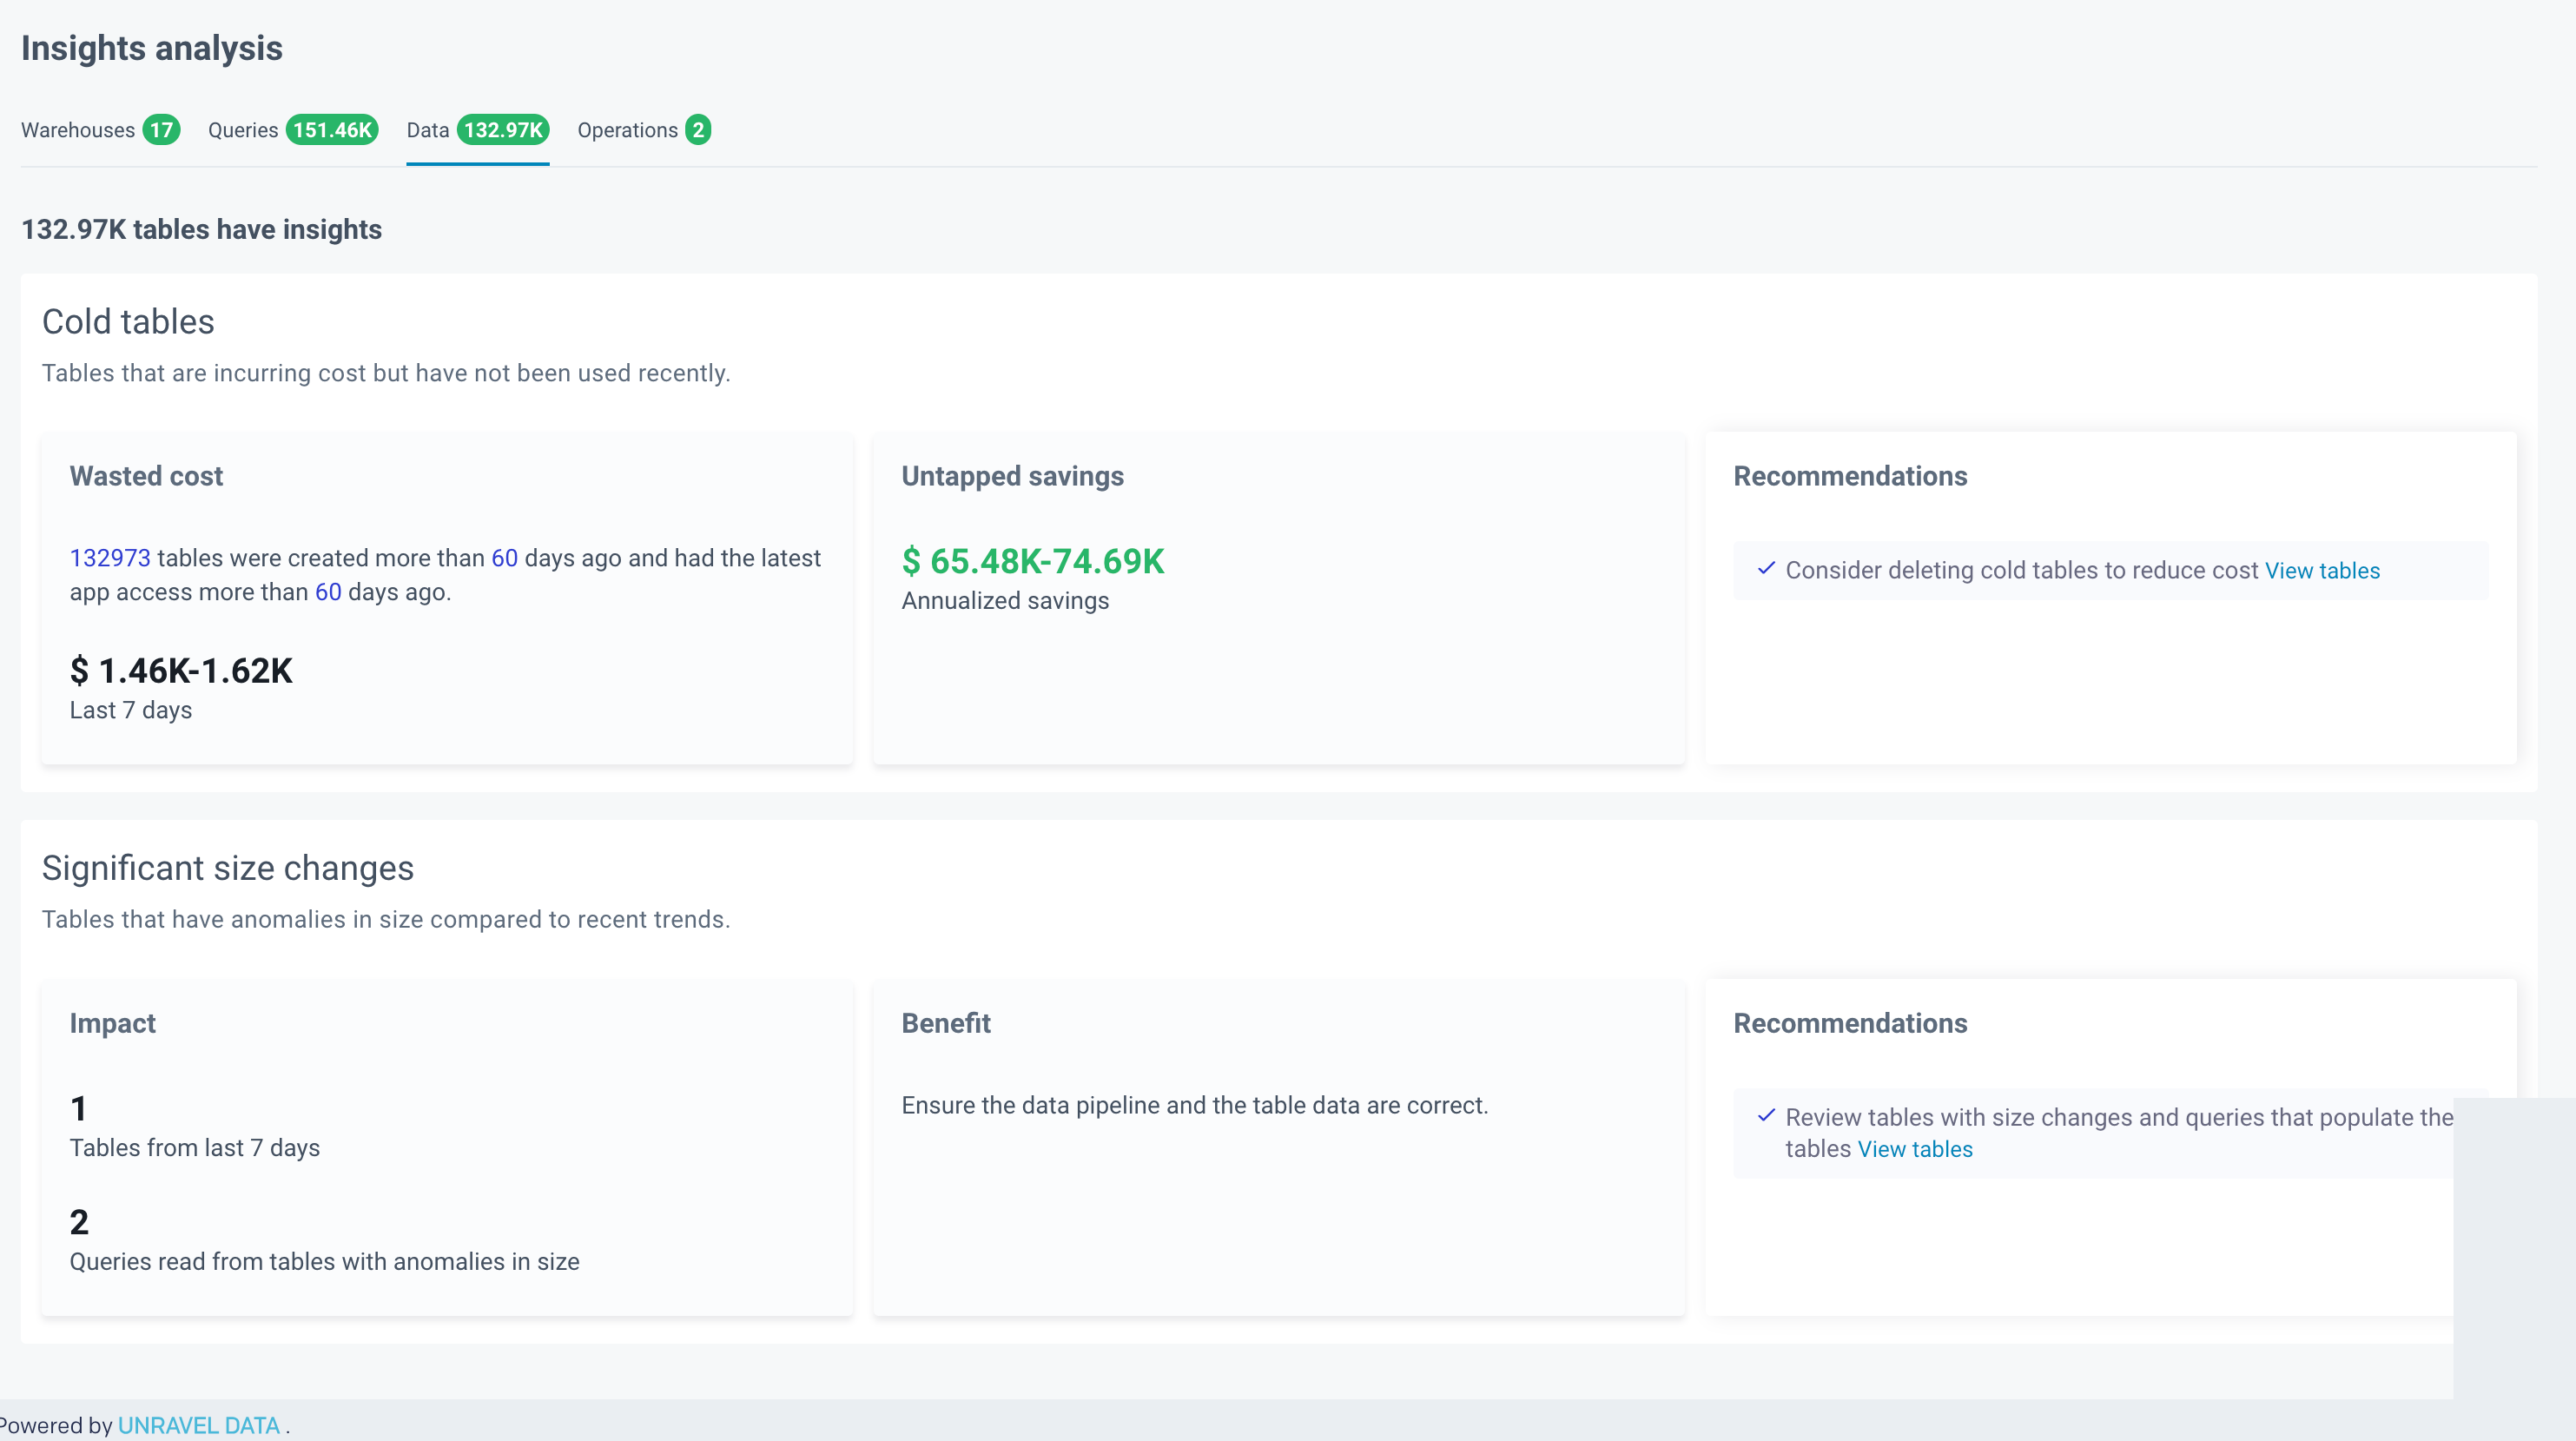
This dashboard displays the insights for the cold tables, the tables that are incurring costs but have not been used recently. It also contains a dashboard for significant size changes, displaying tables with anomalies in size compared to recent trends.
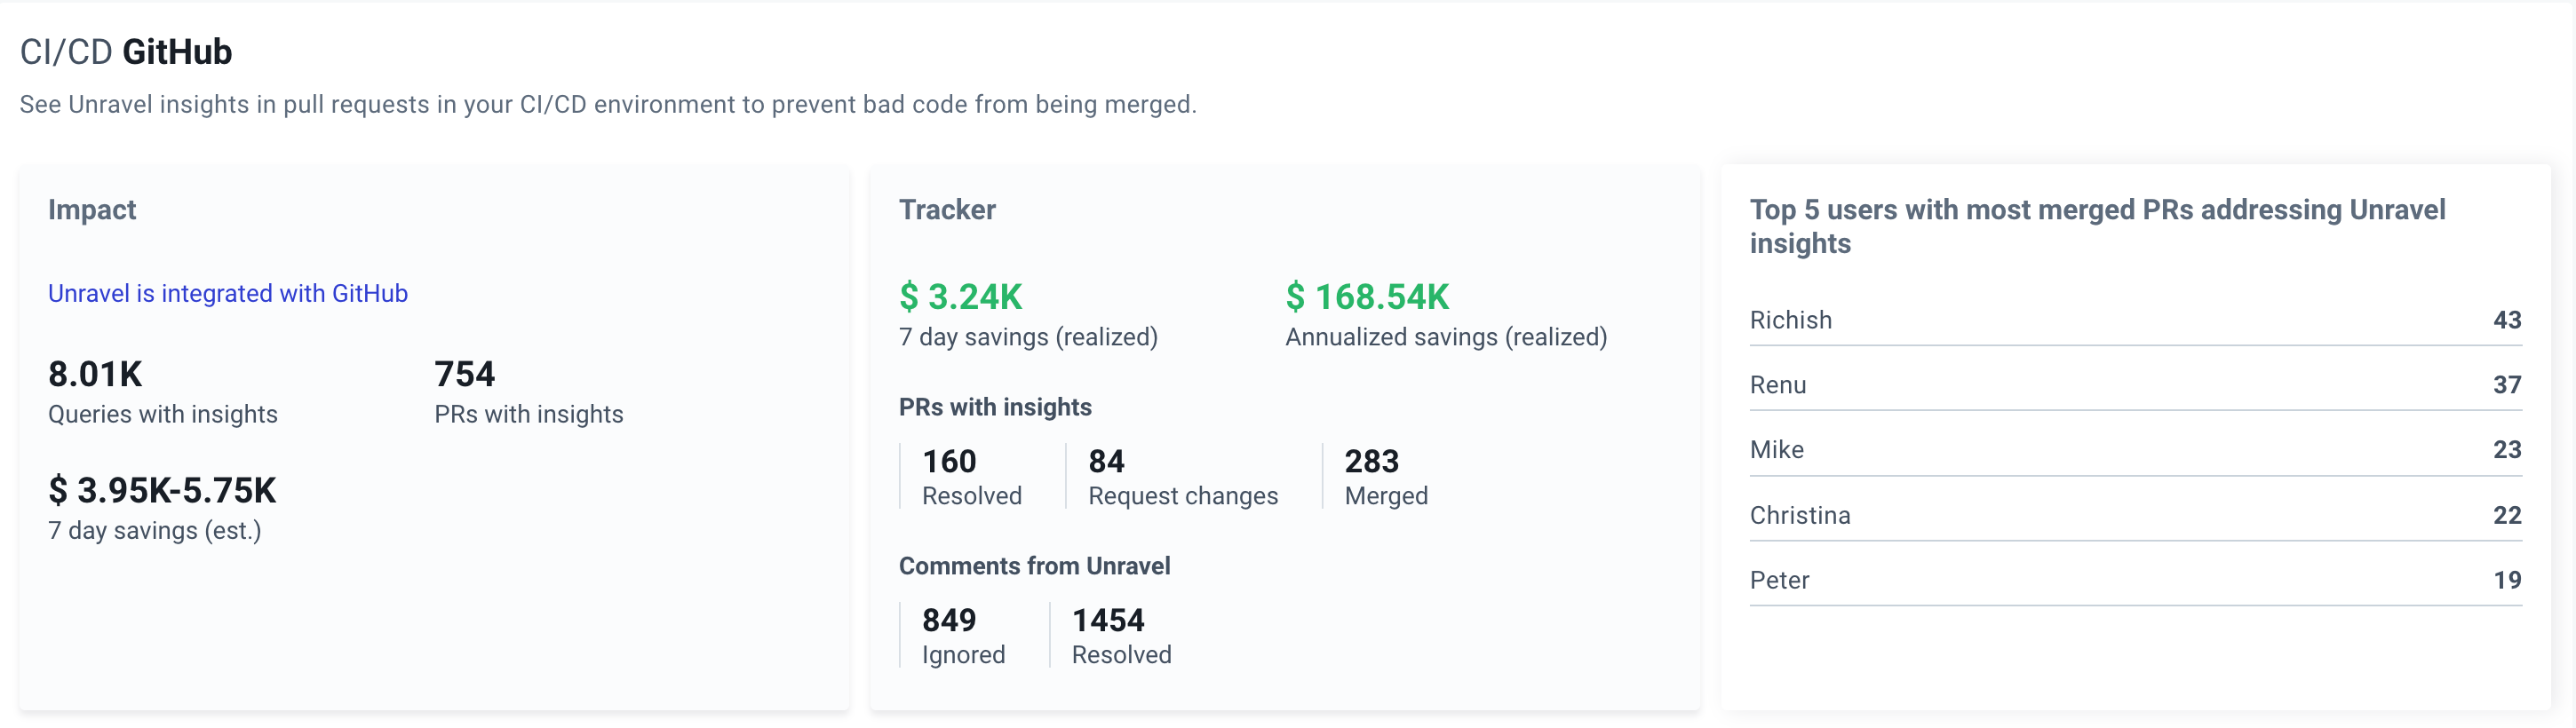
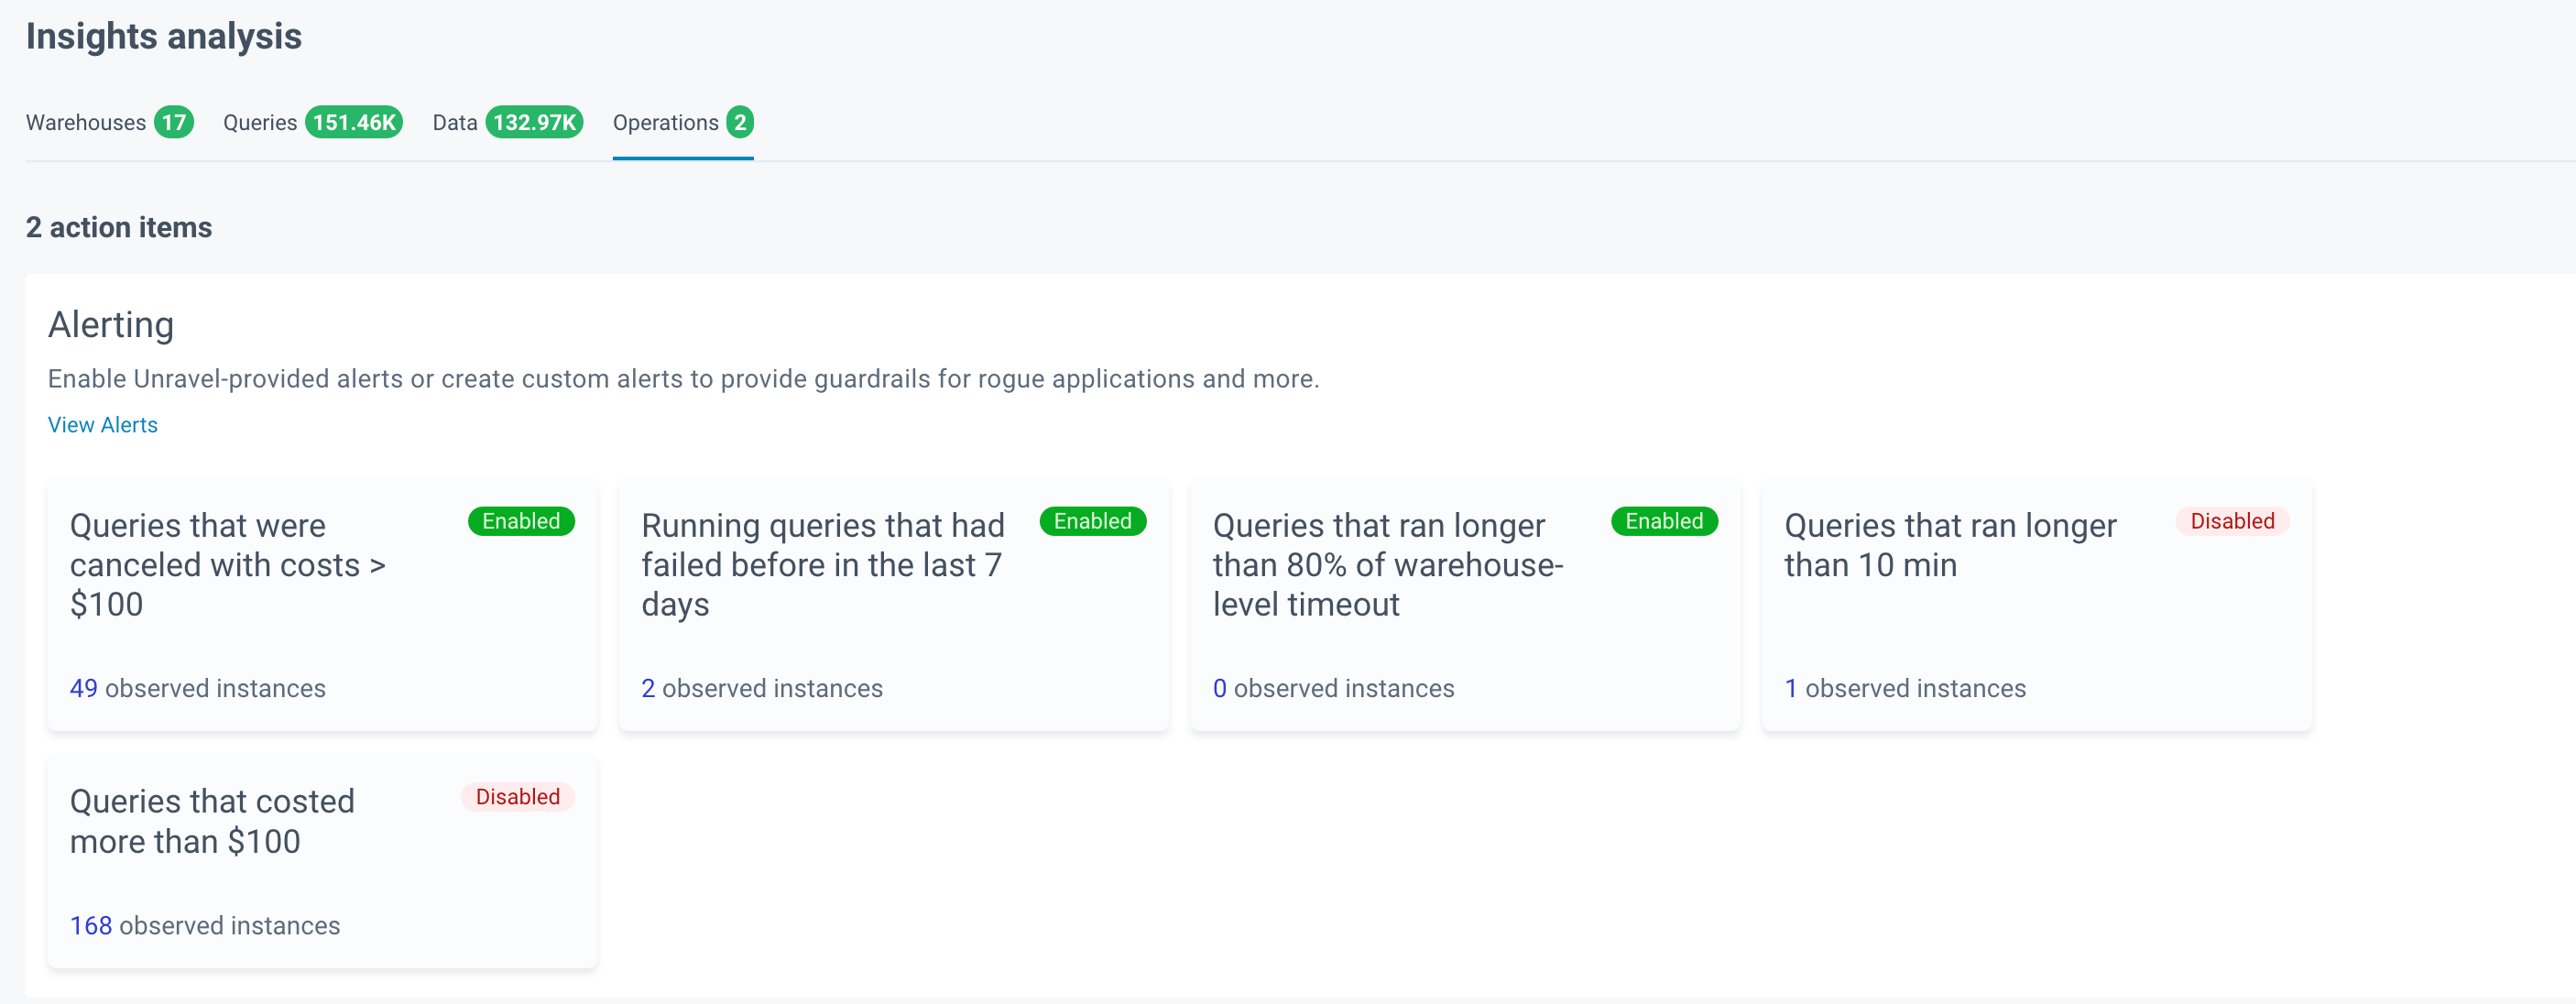
The Operations dashboard contains the alerts and CI/CD recommendations.
View Unravel-provided alerts from the alerting section of the operations tab even when the alerts are not configured.
Track how many Unravel recommendations from your CI/CD have been accepted and how many have not from the CI/CD section of the Operations tab.