Yarn Application Killer
Overview
The Yarn Application Killer Appstore App is designed to help administrators and operators efficiently manage and terminate problematic or unnecessary YARN applications within their cluster. By allowing users to specify application, user, and incident details, this tool streamlines the process of identifying and acting on resource-consuming or failed applications, improving overall cluster stability and resource utilization.
Key features
Targeted Application Termination: Enter specific Application IDs, User IDs, or Incident IDs to identify and terminate relevant YARN applications.
Batch Operations: Add multiple applications for bulk management and termination.
Historical Data Export: Download historic termination data as a CSV for auditing and reporting purposes.
Result Tracking: View real-time feedback on termination actions, including event time, application/user/instance details, status, and messages.
Usecase
A cluster administrator receives an alert that several YARN applications are consuming excessive resources and impacting other jobs. Using the Yarn Application Killer, the administrator enters the Application IDs and User IDs of the problematic jobs, adds them to the batch, and submits the request. The app processes the termination, and the administrator reviews the result table to confirm successful completion. For compliance purposes, the administrator downloads the historical data as a CSV file for record-keeping and future reference.
Accessing the app
Refer to Installing and accessing the apps.
Using the app
Use the Application Killer app to quickly identify and terminate specific YARN applications by entering relevant application, user, or incident details, manage multiple termination requests, and review the results and history of all actions performed.
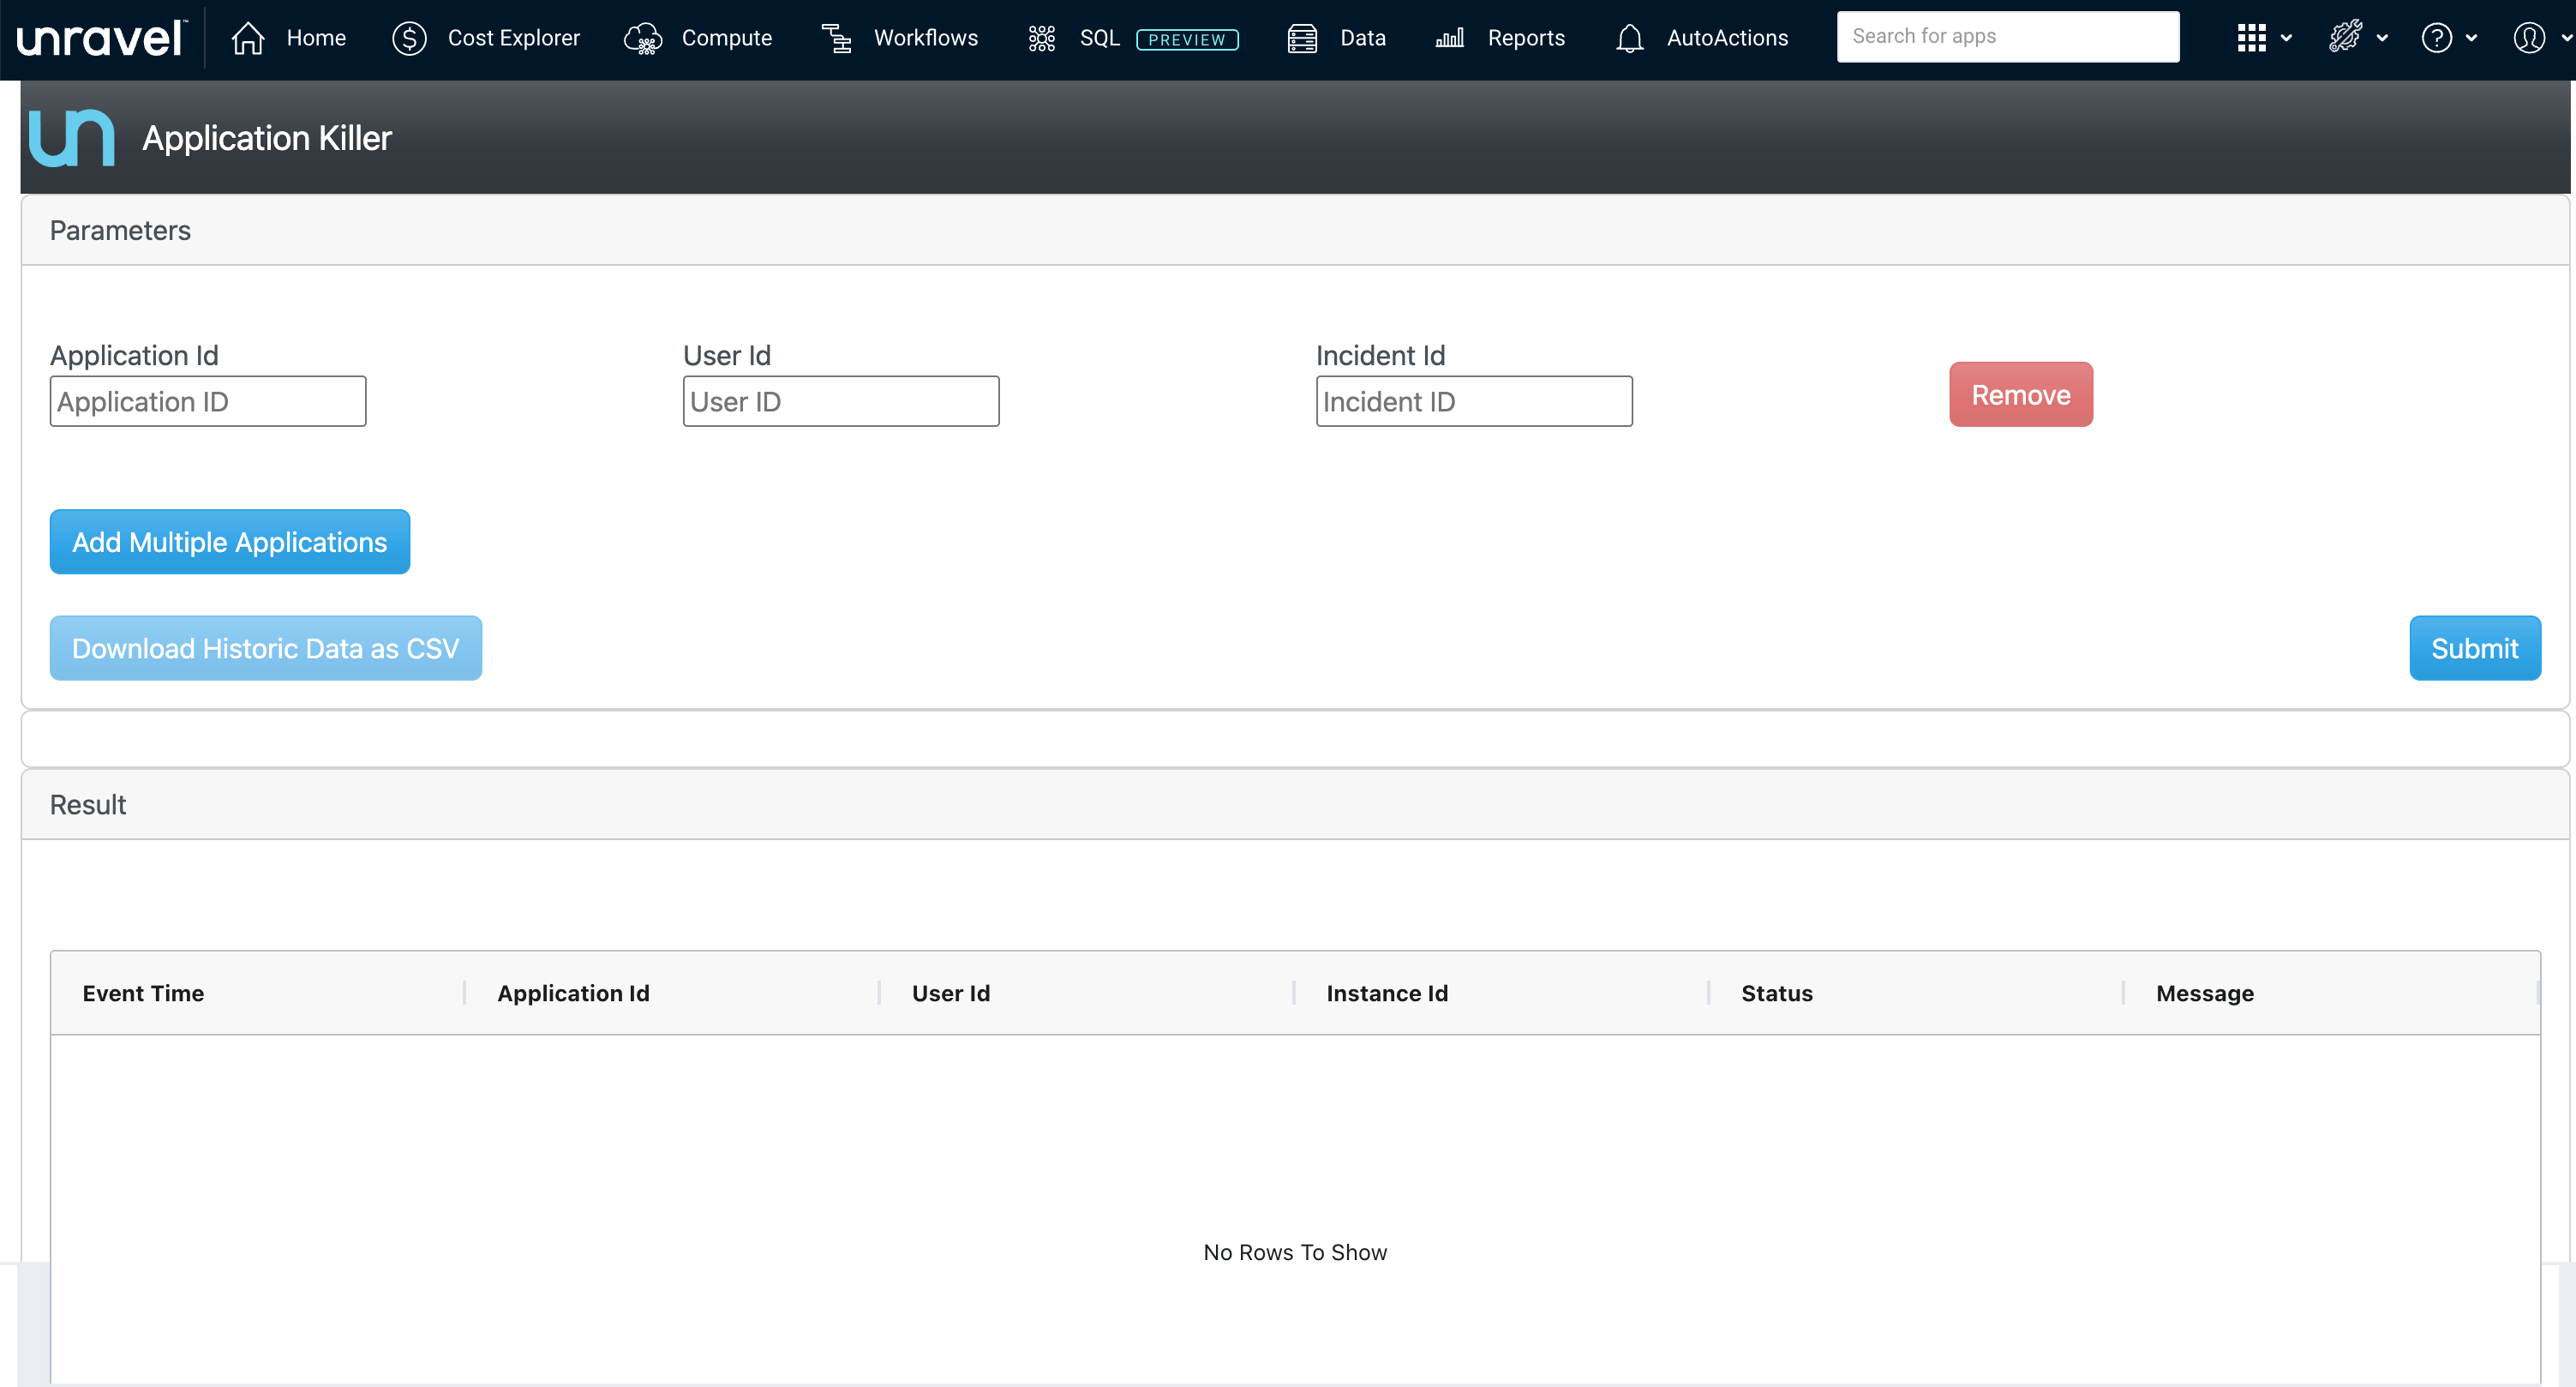
Enter the parameters.
Application Id: Enter the YARN Application ID to target a specific application.
User Id: (Optional) Enter the User ID associated with the application.
Incident Id: (Optional) Enter an Incident ID for tracking or compliance purposes.
Manage the applications.
To terminate multiple applications in one action, click Add Multiple Applications and enter additional Application IDs as needed.
To remove an entry, use the Remove button next to the relevant row.
Once all required fields are populated, click Submit to initiate the termination process.
The Result table displays the outcome of each action, including:
Use this section to confirm successful application termination or diagnose any issues.
Event Time
Application Id
User Id
Instance Id
Status
Message
Click Download Historic Data as CSV to export a record of past termination actions for auditing or compliance.
Dashboard analysis
The Yarn Application Killer dashboard provides a comprehensive, real-time overview of YARN application activity and termination events, enabling administrators to monitor cluster health and quickly identify problematic workloads.
Summary
Running / Pending: Instantly see the number of YARN applications currently running or pending in the cluster.
Success: Displays the total count of completed application terminations, confirming effective action.
Failed: Shows the number of termination attempts that failed, helping you identify potential issues requiring further investigation.
Insufficient Events: Indicates the number of events where termination could not proceed due to missing or insufficient information, highlighting areas for data quality improvement.
Running: Tracks the number of applications in various states (for example, NEW_SAVING, Running, Accepted, SUB) over time. This helps you monitor trends in application submissions and resource utilization.
By Status: Visualizes the daily count of applications by their final status (Success, Failed). Spikes in failures or successes can indicate operational issues or successful cleanup actions.
Insufficient Events: Displays the frequency of insufficient events by application type (MapReduce, Hive, Spark, Tez), allowing you to pinpoint which frameworks are most affected by incomplete termination data.
By Type: The donut chart gives a breakdown of application types (Spark, Hive, Tez, MapReduce) processed by the app, while the corresponding line chart shows how their activity changes over time. This helps you identify which processing frameworks are most prevalent and may require closer monitoring.
Use the top-row metrics and trend charts to get an immediate sense of cluster workload, termination effectiveness, and any issues with application killing.
Investigate spikes in failed or insufficient events to proactively address recurring issues or gaps in application metadata.
Focus on the application types and users contributing most to running or inefficient jobs, using the breakdowns to guide targeted remediation.