Insights Dashboard
Overview
The Insights Dashboard is a specialized observability application and decision-support tool. It provides actionable intelligence to help you reduce Databricks spend by identifying inefficiently configured clusters and automated jobs. By analyzing historical performance data, the application calculates "untapped savings"—the actual dollar amount you can recover through infrastructure optimization.
The dashboard addresses "configuration drift," where All-Purpose clusters (used for development) and Job Compute clusters (used for production) become over-provisioned or lack proper scaling.
Key features
Savings quantification: View high-level metrics like Total Untapped Savings and Potential Annual Savings to justify infrastructure changes to stakeholders.
Time-based event analysis: Filter infrastructure events by specific ranges (Today, Last 7/30/90 Days) to identify recent or long-term waste.
Signature-based job analysis: Group repetitive production jobs using Unravel’s "Signature" logic to provide high-confidence optimization recommendations.
Photon benefit analysis: Predict the specific speedup and cost-reduction potential of enabling the Databricks Photon engine for your workloads.
Advanced backend integration: Synthesizes data from unravel.properties and multiple Elasticsearch indices (ev-*, signature_insights, and app-*) to provide precise cost and configuration audits.
Example use case
Imagine you are a platform admin who notices that Job Compute costs are rising despite a steady number of scheduled jobs. You can use the Insights Dashboard to investigate:
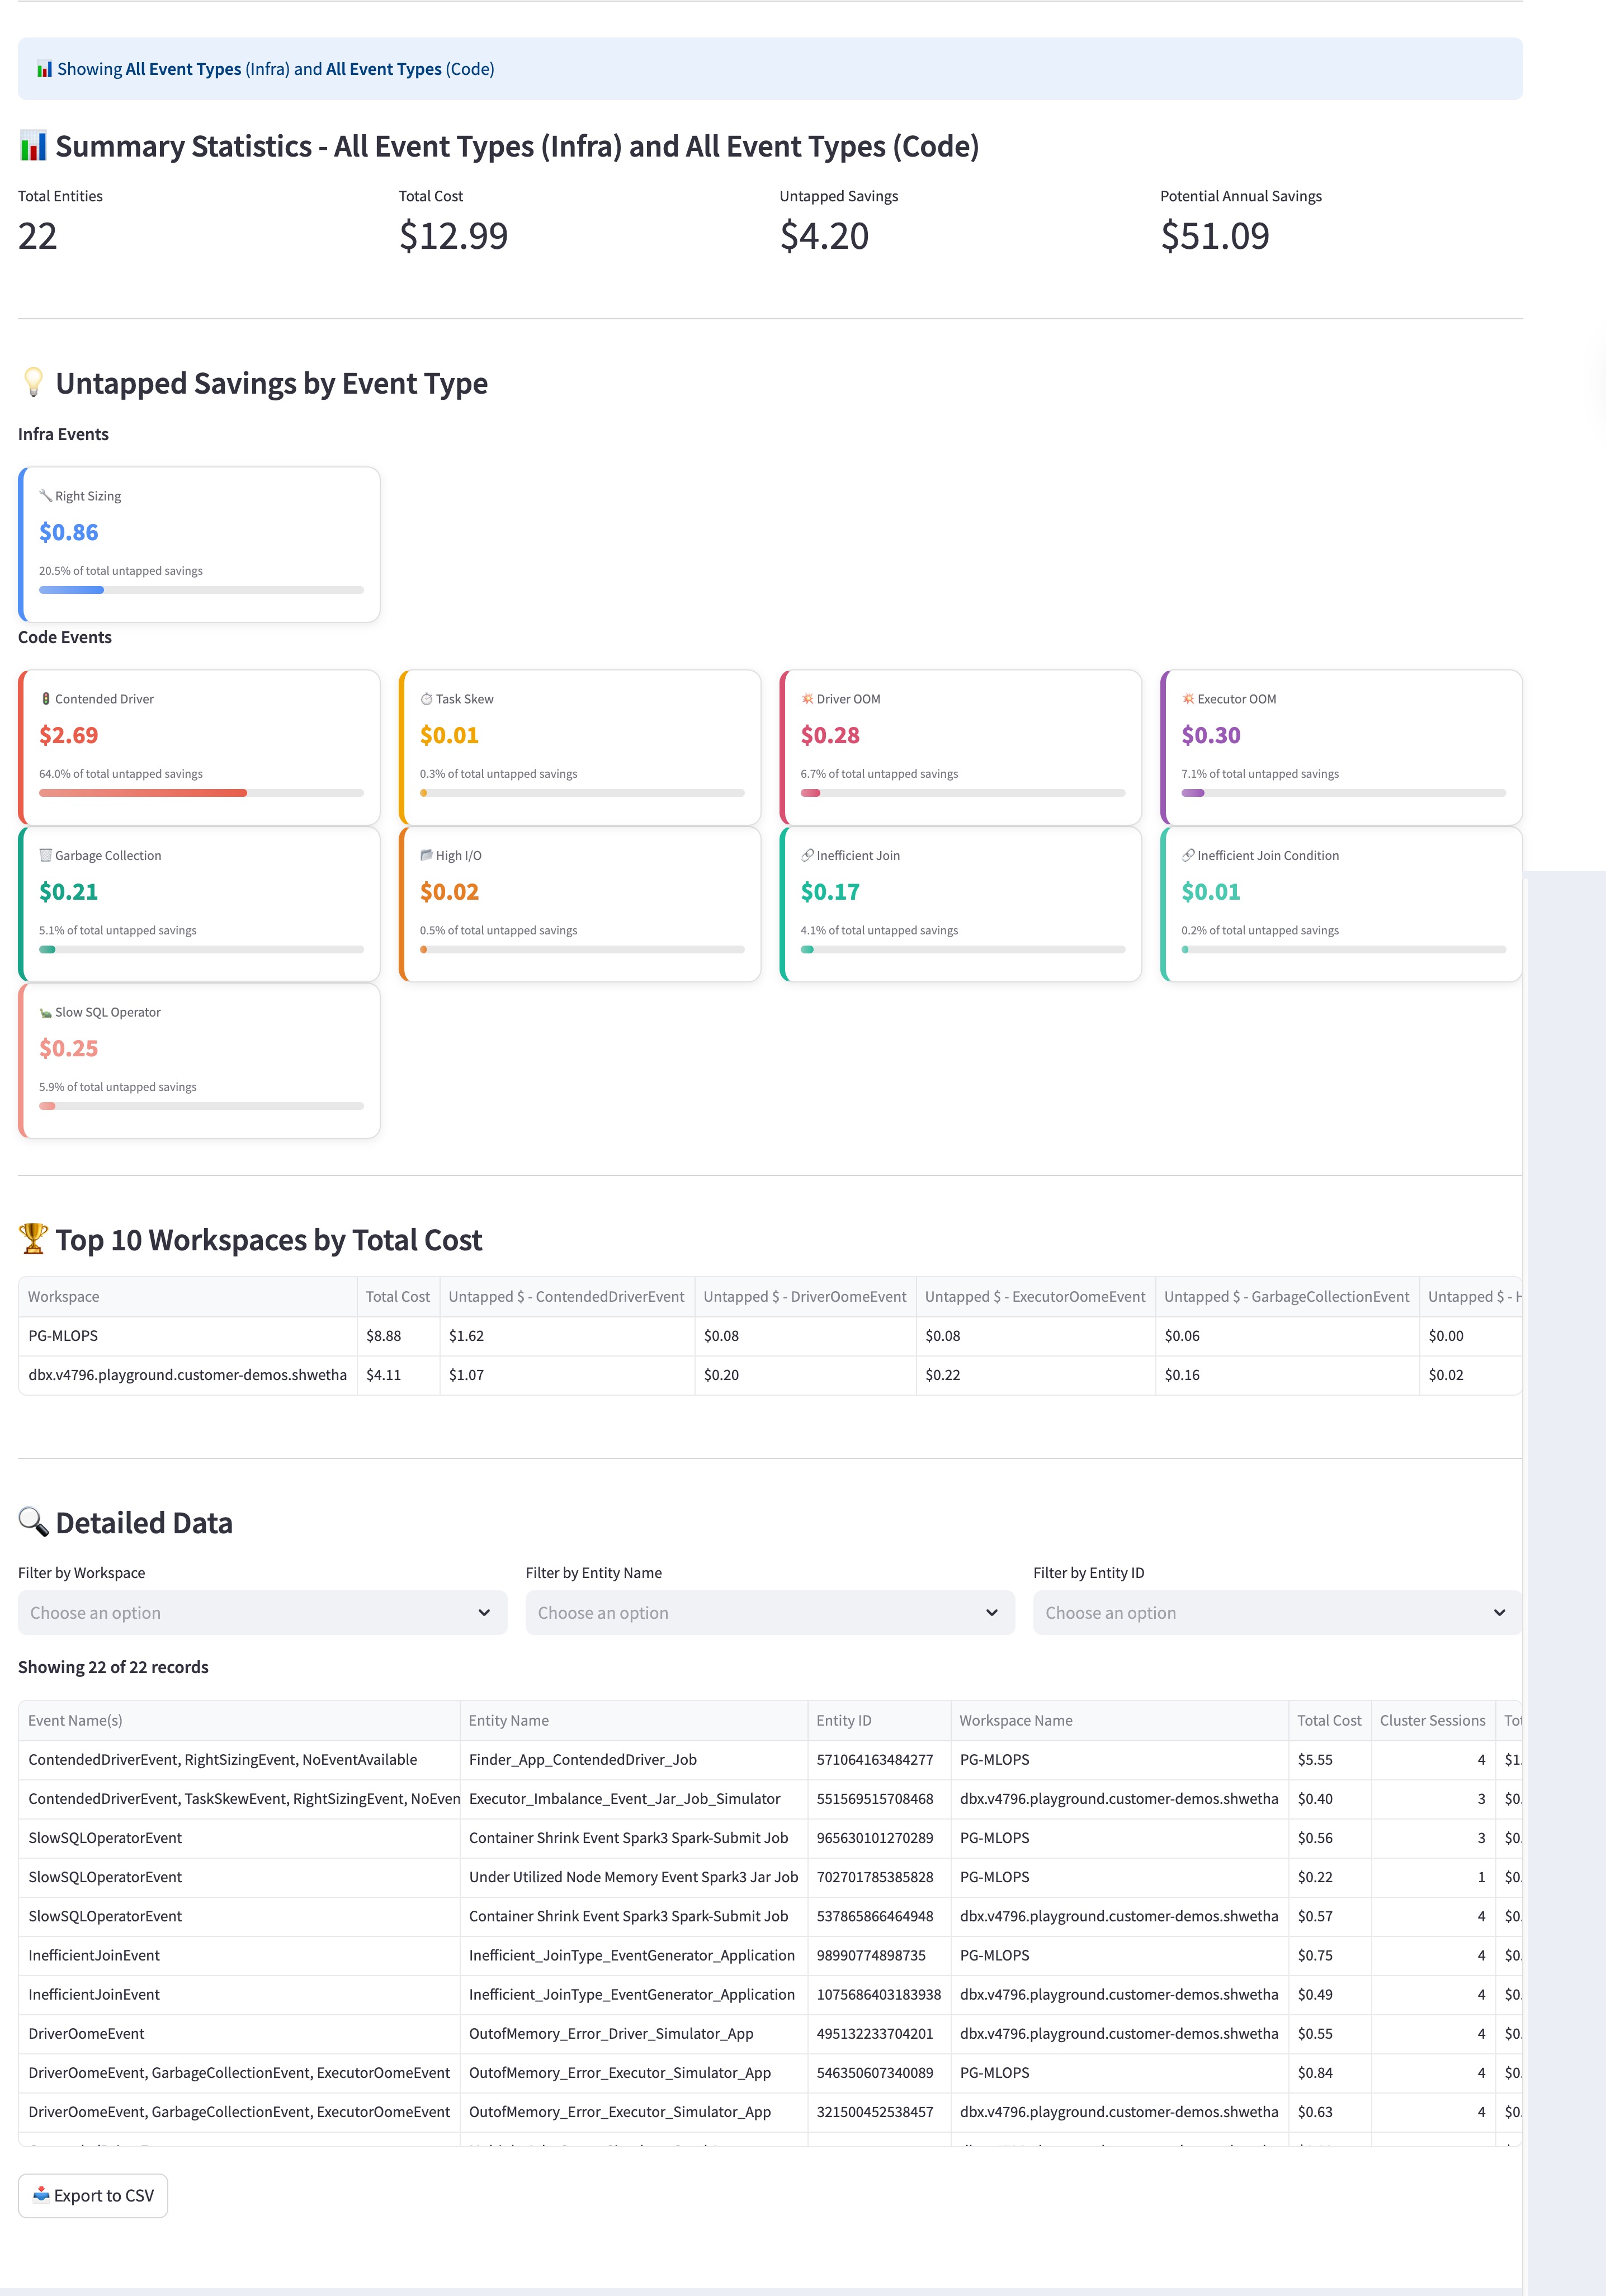
Spot the savings: You open the Job Compute Cluster Insights view and see that your Potential Annual Savings is over $50.
Filter the source: You look at the Untapped Savings by Event Type section and notice a large red bar for Contended Driver code events, representing over $2.00 in wasted spend.
Identify the specific job: You scroll to the Detailed Data table and filter by the Contended Driver event. You find a specific "Under App: ContentDriver Job" that has run 11 sessions.
Take action: Now that you know exactly which job is struggling with driver contention, you can work with the developer to increase the driver size or optimize the code, directly reducing the wasted cost for all future runs.
Installing the app
For instructions on how to install and access the app, refer to Installing and accessing the app.
Filters
Use filters to refine the data displayed on the dashboard. When you apply a filter and select Fetch Insights, the charts and tables update to reflect your criteria.
Time Range: Select a period, such as the Last 30 Days, to track efficiency over time.
Event Type: Narrow your search to specific infrastructure events (like Node Downsizing) or code events (like Inefficient Join).
Entity Filters: Search for specific Workspace Name, Entity Name, or Entity ID to find data for a particular project.
Using the app
The dashboard is split into two primary tabs: All-Purpose Clusters and Job Compute Clusters.
All-Purpose Cluster Insights
Use this module to audit clusters used for interactive development.
Select a Time Range: Choose a range, such as Last 30 Days, to capture relevant historical data.
Select an Event Type: Choose a specific event to investigate, or leave it as All Event Types for a full audit:
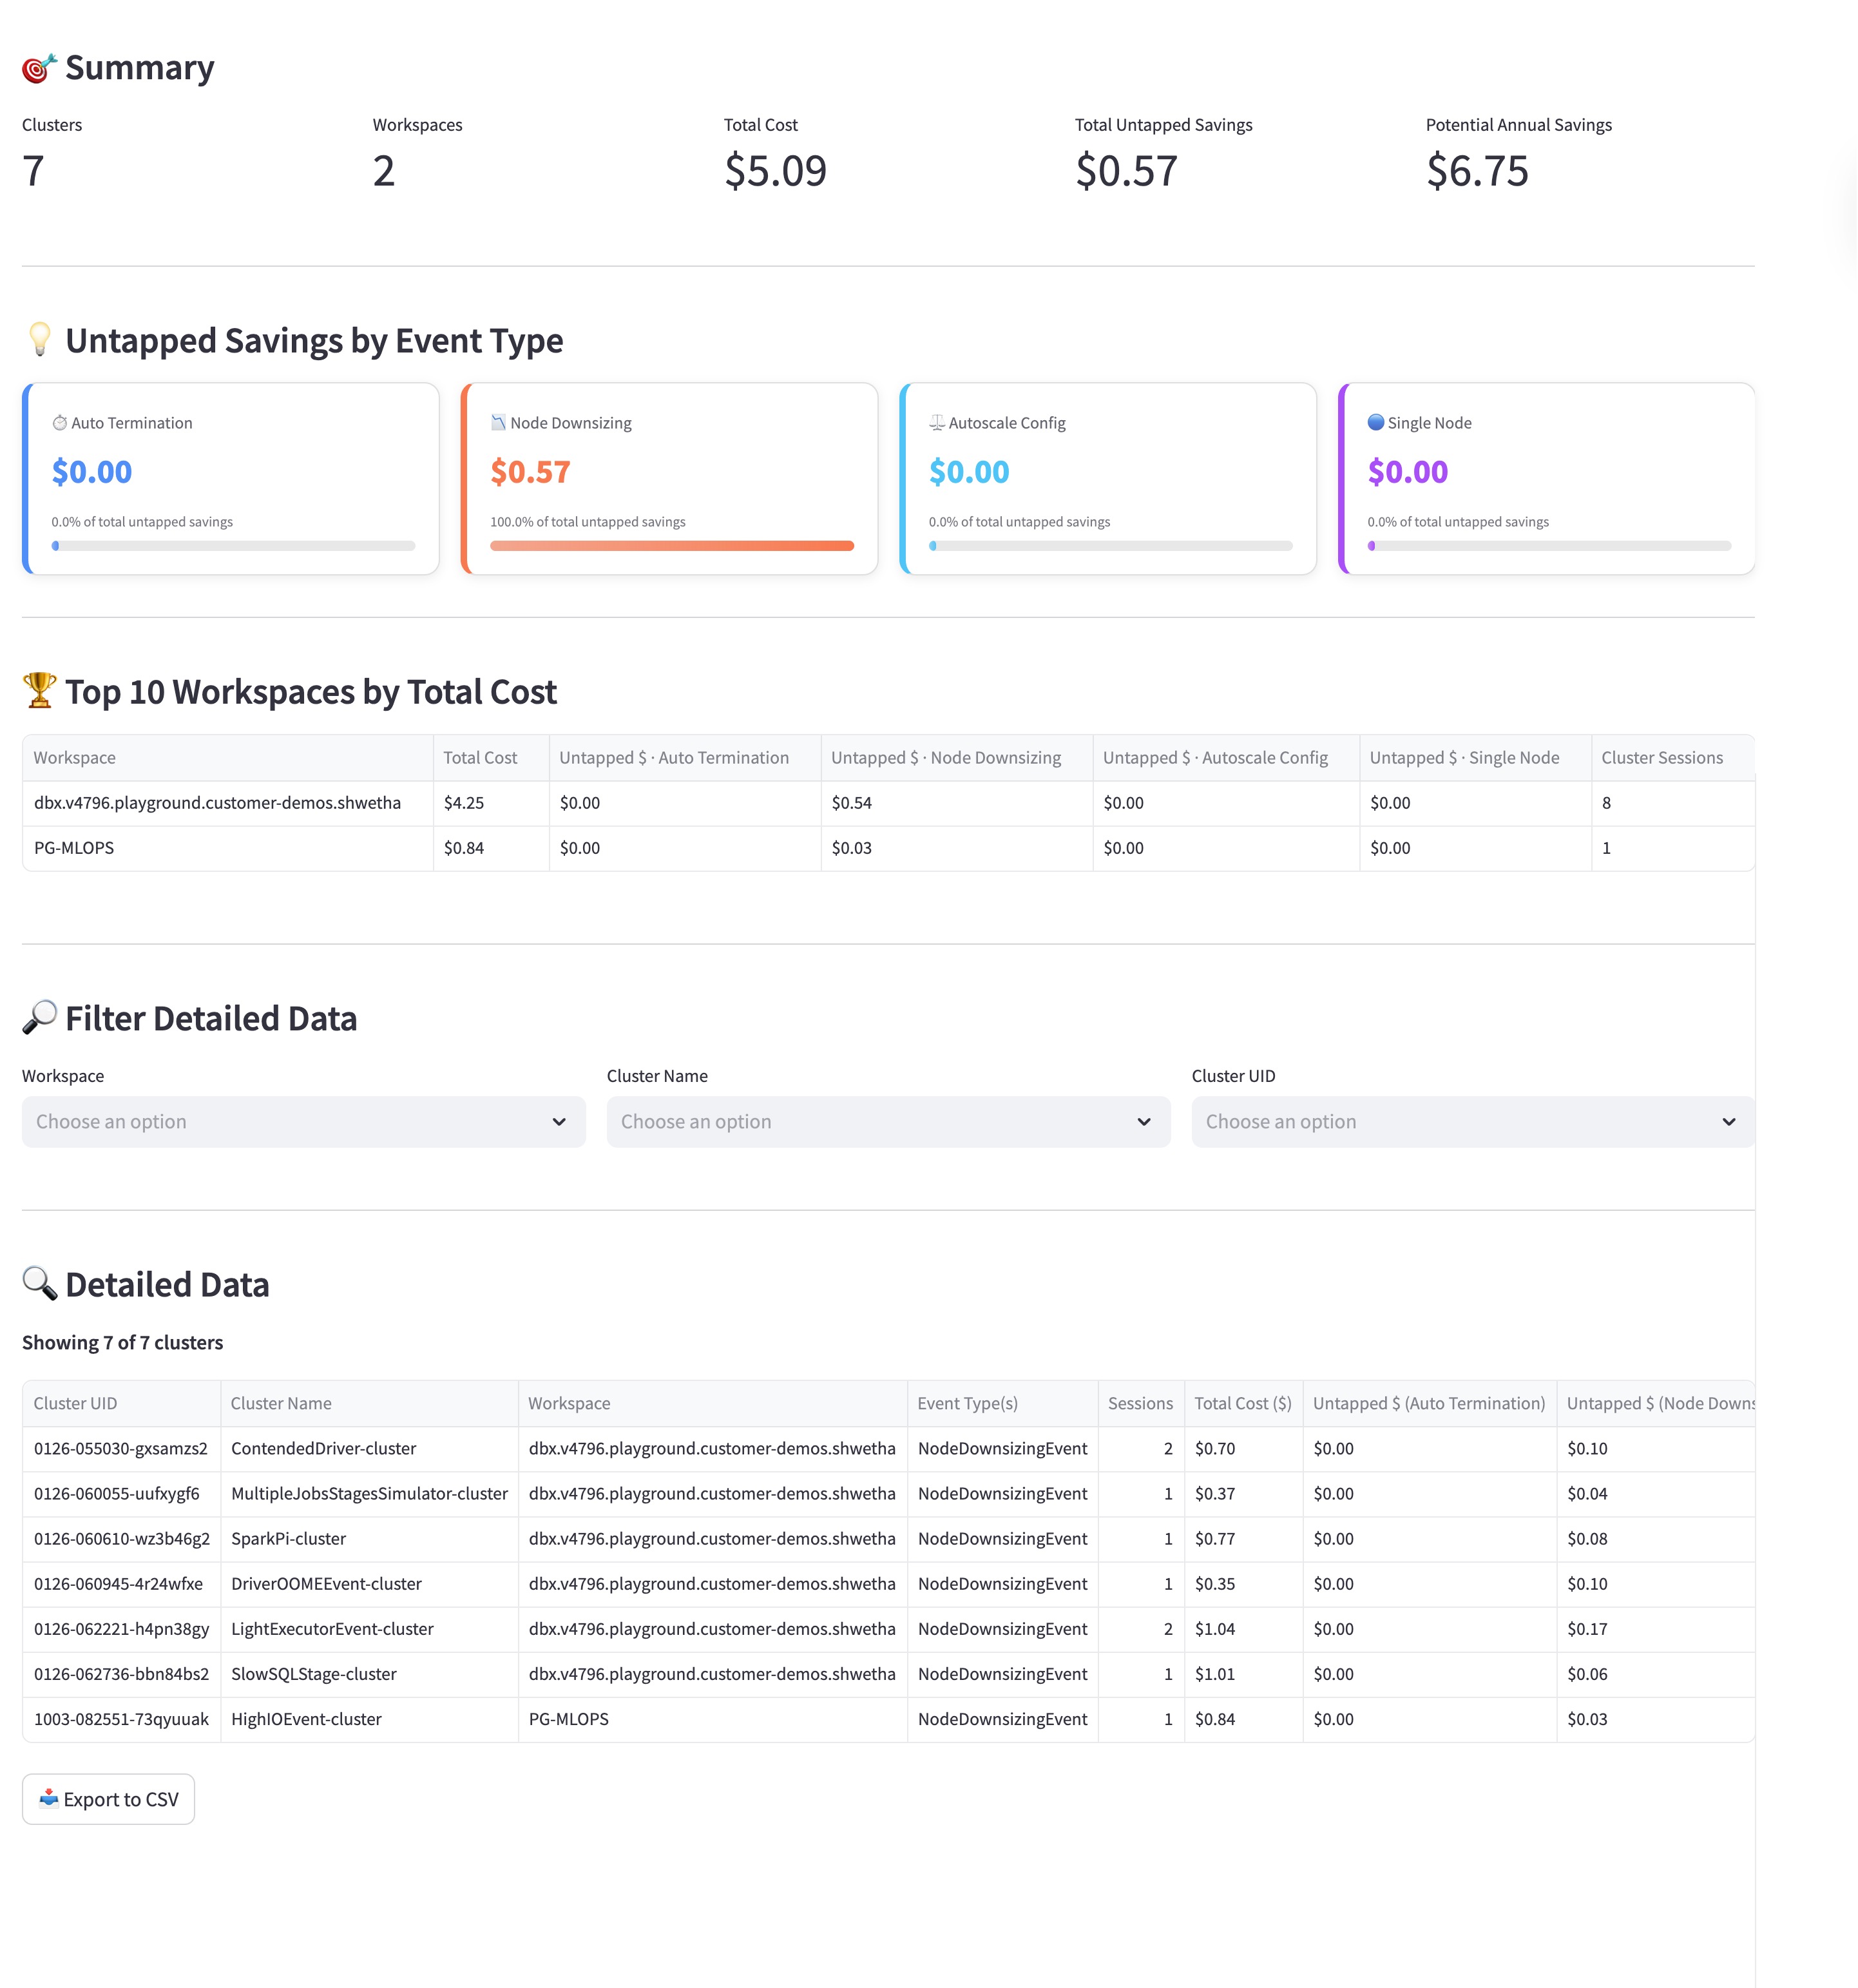
AutoTerminationEvent: Identifies clusters with high idle-time settings and recommends a lower threshold.
NodeDownsizingEvent: Recommends smaller instance types based on actual CPU and memory utilization.
AutoScaleConfigEvent: Identifies clusters with fixed worker counts that should use autoscale settings.
Fetch Insights: Select Fetch All-Purpose Insights to update the summary statistics and the detailed data table.
Savings Summary: Review the Potential Annual Savings tile to see how much you could save over a year by optimizing your current all-purpose clusters.
Infrastructure Efficiency: Use the Untapped Savings by Event Type section to identify misconfigurations. For example, look for Auto Termination events to find clusters that stay active while idle, or Node Downsizing opportunities where a smaller, less expensive instance could handle the workload.
Workspace Rankings: Check the Top 10 Workspaces by Total Cost table to see which development environments are the most expensive and prioritize them for review.
Entity Details: Use the data table at the bottom to find specific clusters by name or ID. You can see the exact event types triggered for each cluster, helping you decide which ones need updated configuration settings.
Job Compute Cluster Insights
Use this module for production workloads and automated jobs.
Select a Time Bucket: Choose 7D, 30D, or 90D to analyze recurring job signatures.
Fetch Insights: Select Fetch Job Compute Insights.
Review Recommendations:
Photon Speedup: Identify jobs that will run faster and cheaper with Photon enabled.
Instance Recommendations: View specific worker and driver instance changes to reduce spend.
ROI Optimization: Use the Potential Annual Savings column to prioritize the highest-impact changes.
The following metrics are displayed:
Performance Metrics: Track the Total Entities (number of jobs) and their Total Cost to monitor the operational overhead of your data pipelines.
Code-Level Analysis: Unlike infrastructure views, this section highlights Code Events like Garbage Collection, Inefficient Join, and Contended Driver. These insights show you where the job code itself—rather than the cluster settings—is causing performance bottlenecks and wasted spend.
Job Specifics: Look for recurring inefficiencies in specific job runs. For instance, if a job frequently triggers a Contended Driver event, it indicates that the driver node is overloaded, potentially delaying the entire pipeline and increasing costs.
Export and Action: Use the Export to CSV button to share a list of inefficient job signatures with your engineering teams so they can refactor the code or adjust the resource allocation.