Cost Savings
The Cost Savings App helps you monitor, track, and analyze cost reductions across jobs and interactive clusters. By detecting key changes, such as configuration updates and code/data modifications, it quantifies their impact and aggregates savings data over different time frames.
Unlike traditional cost monitoring tools that provide only high-level expense tracking, this app identifies specific optimizations that reduce costs. It offers insights at the job, cluster, and signature levels, allowing you to pinpoint the most effective cost-saving strategies.
Key features
Real-time cost tracking – Provides instant visibility into cost savings across jobs and clusters.
Breakdown of savings sources – Differentiates between savings from code/data changes and configuration changes.
Time-based cost insights – Displays savings for the current period, period-to-date (PTD), and projected annual savings. Additionally, it provides historical savings data with monthly lookups and bucket-wise views for 7, 14, 30, and 90 days.
Granular cost analysis – Enables you to drill down into job-level and cluster-level savings.
Trend forecasting and planning – Uses historical savings trends to help you anticipate future savings.
Configuration change impact analysis – Tracks system configuration adjustments, such as CPU, memory, auto-scaling, execution engine, and node type changes, and correlates them with cost reductions.
Installing and opening the app
Refer to Installing apps. to install and launch the app.
Using the App
The Cost Savings App provides insights that help you track and optimize cost efficiency across workloads. By identifying impactful changes and analyzing savings trends, you can make data-driven decisions to maximize cost savings.
Summary
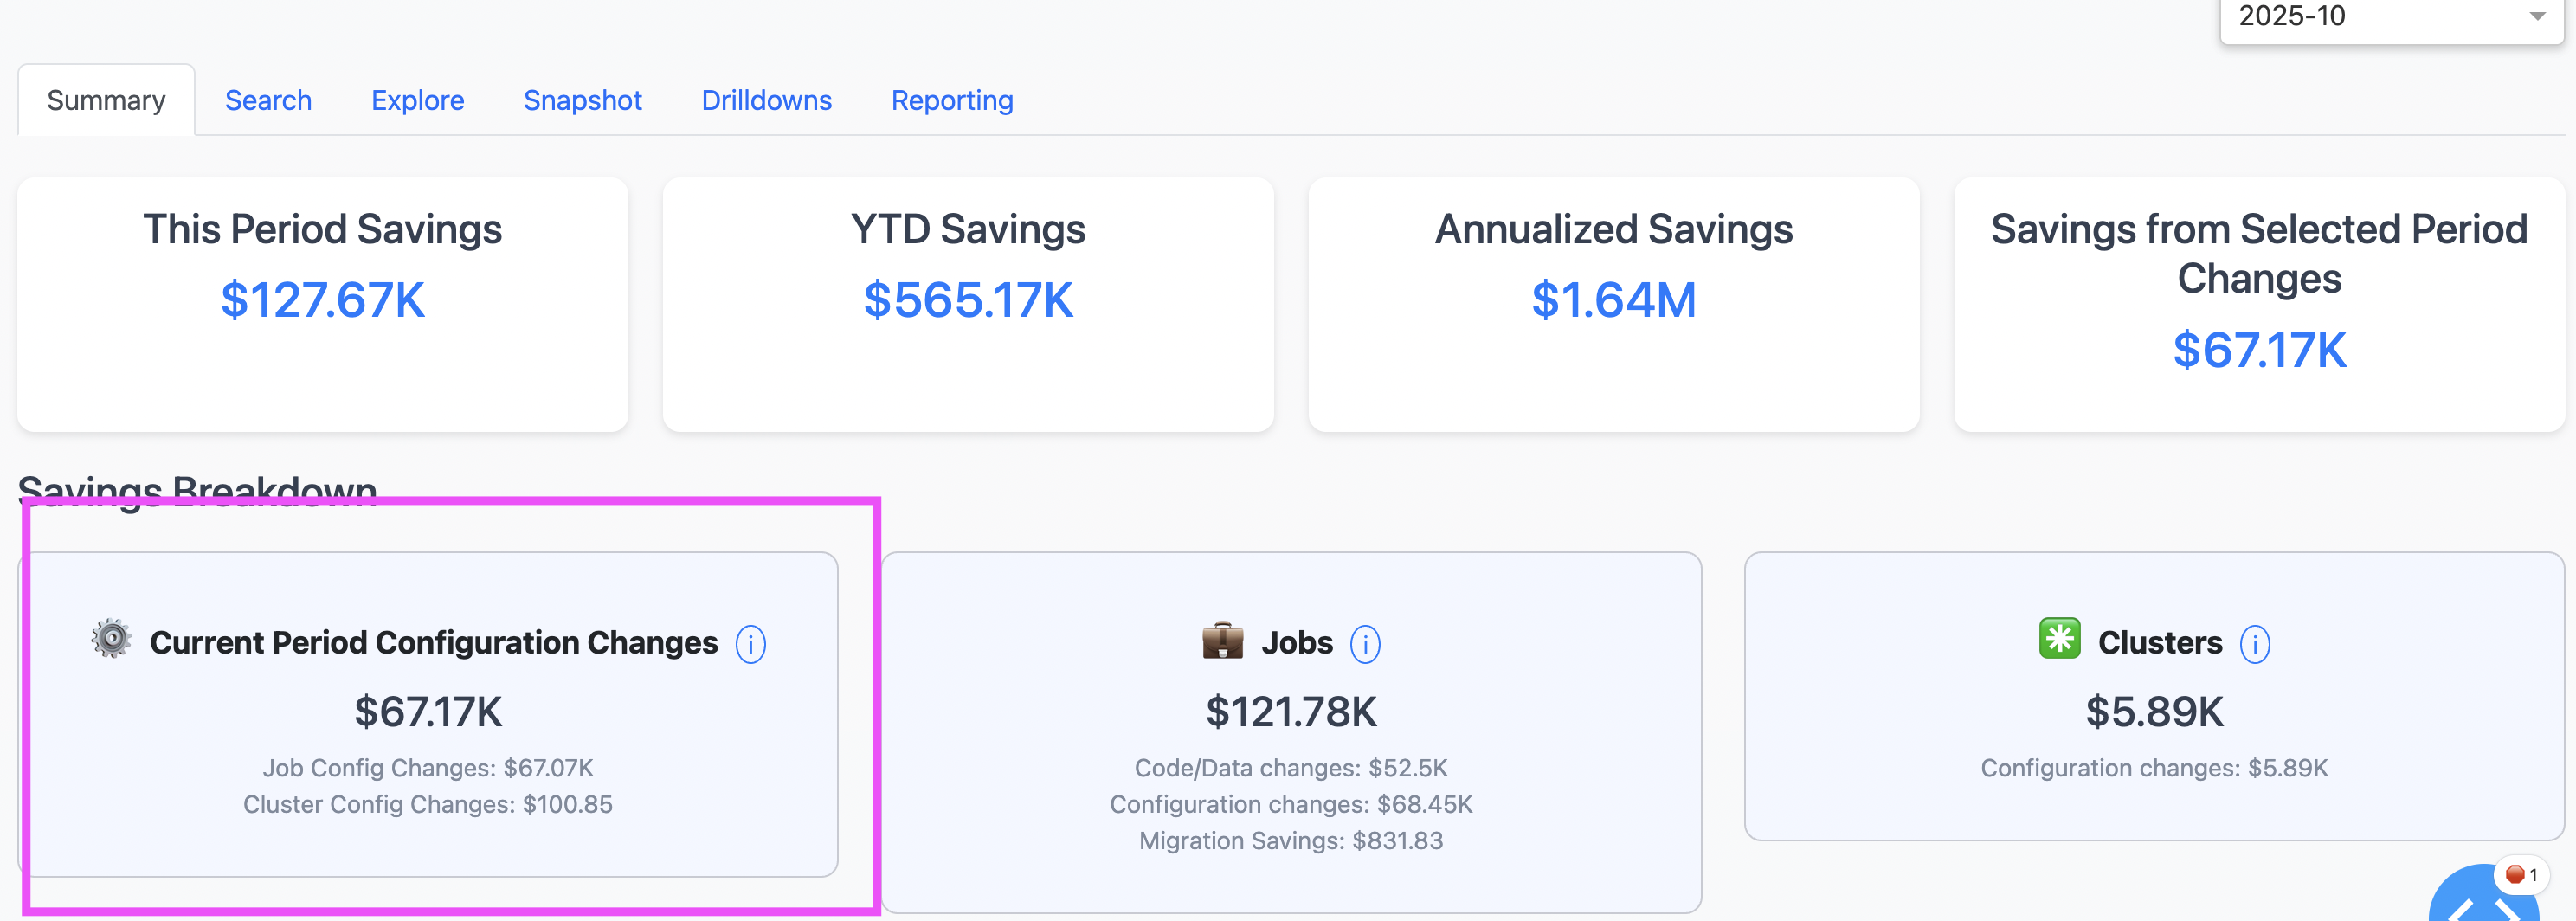
The Summary section provides an overview of total savings from key change points. It includes:
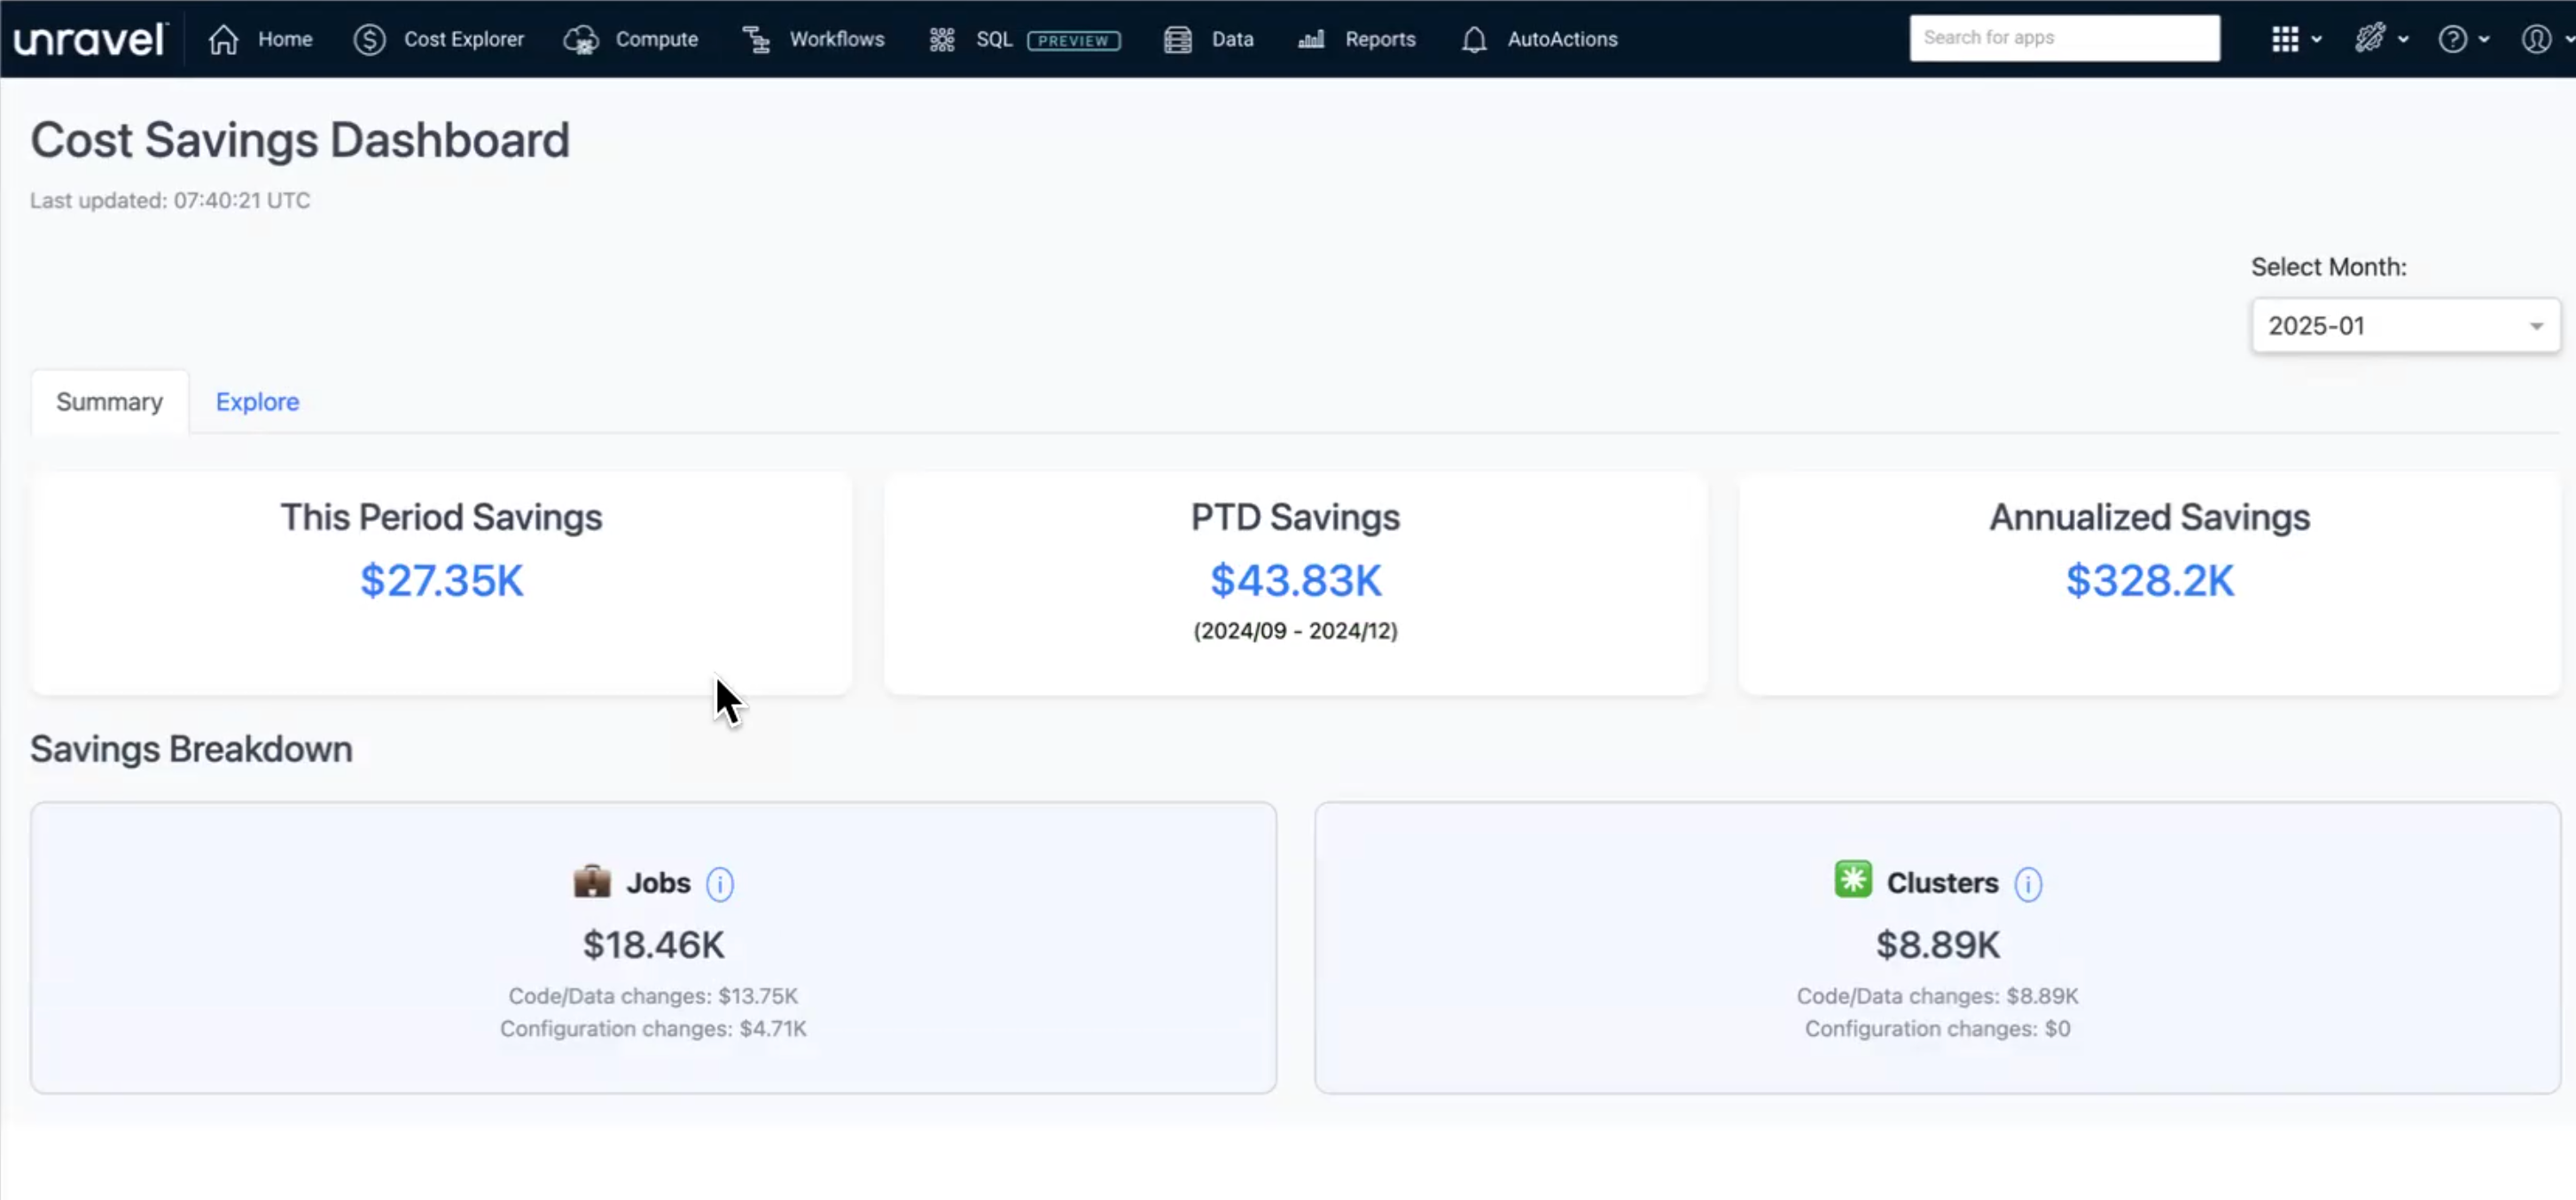
This Period Savings – Total savings achieved during the selected period. You can select a month or choose predefined ranges such as Last 7 days, Last 14 days, Last 30 days, or Last 90 days from the Select Month drop-down.
YTD (Year-to-Date) Savings – Accumulated savings from a defined start date (such as a quarter) to the current month.
Annualized Savings – Estimated savings over a full year based on current trends.
Savings Breakdown – Savings are categorized into:
Jobs – Optimizations applied to individual jobs.
Code/Data Changes – Savings resulting from modifications in code(e.g. Notebook code) or data (For example, Input data Size change).
Configuration Changes – Savings obtained from tuning compute resources, or change in job task submission from one compute to another.
Clusters – Savings derived from cluster-level changes.
Code/Data Changes – Adjustments impacting overall cluster efficiency.
Current Period Configuration Changes – Shows savings from job config changes and cluster config changes in the selected period.
Migration Savings: Savings obtained by migrating job task execution from All-Purpose compute to Job-compute.
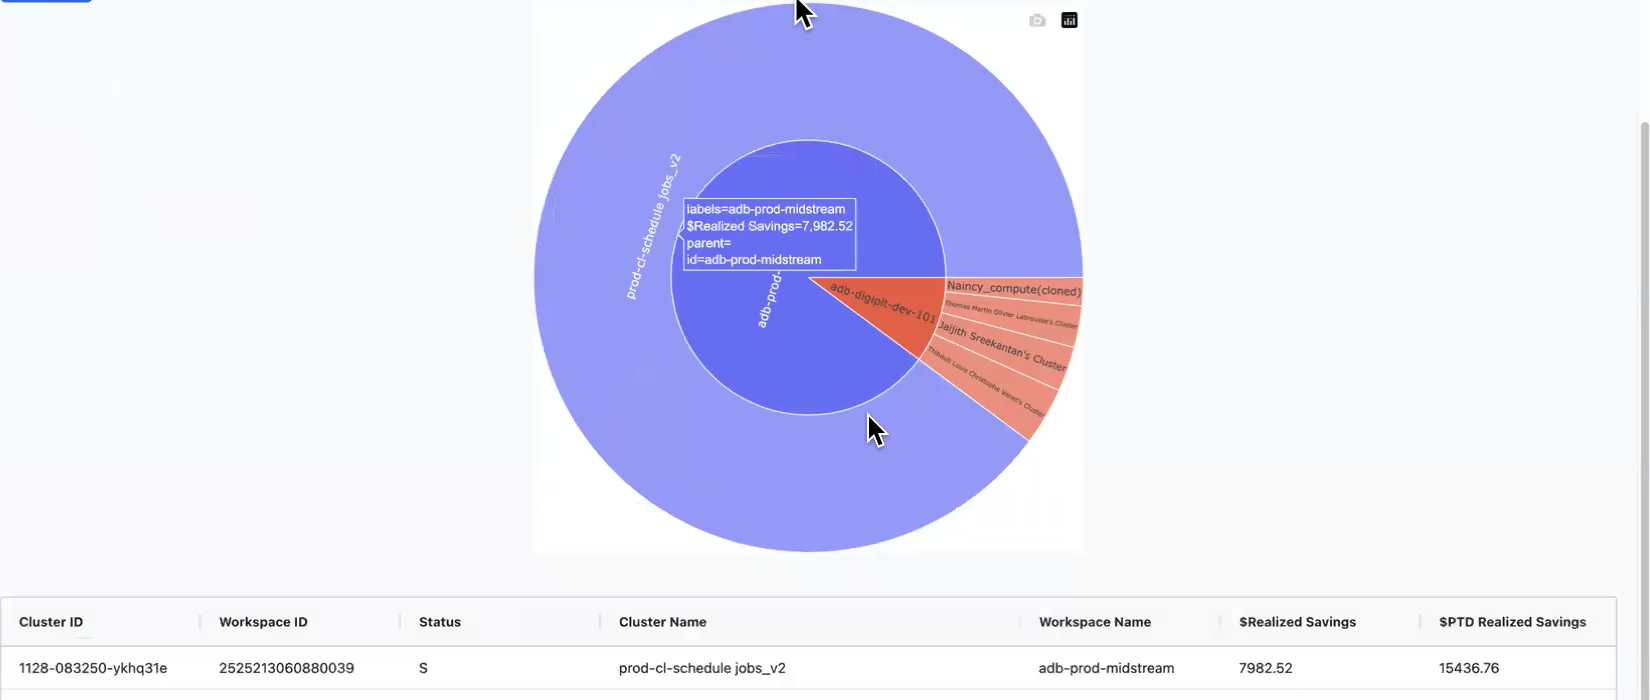
Explore
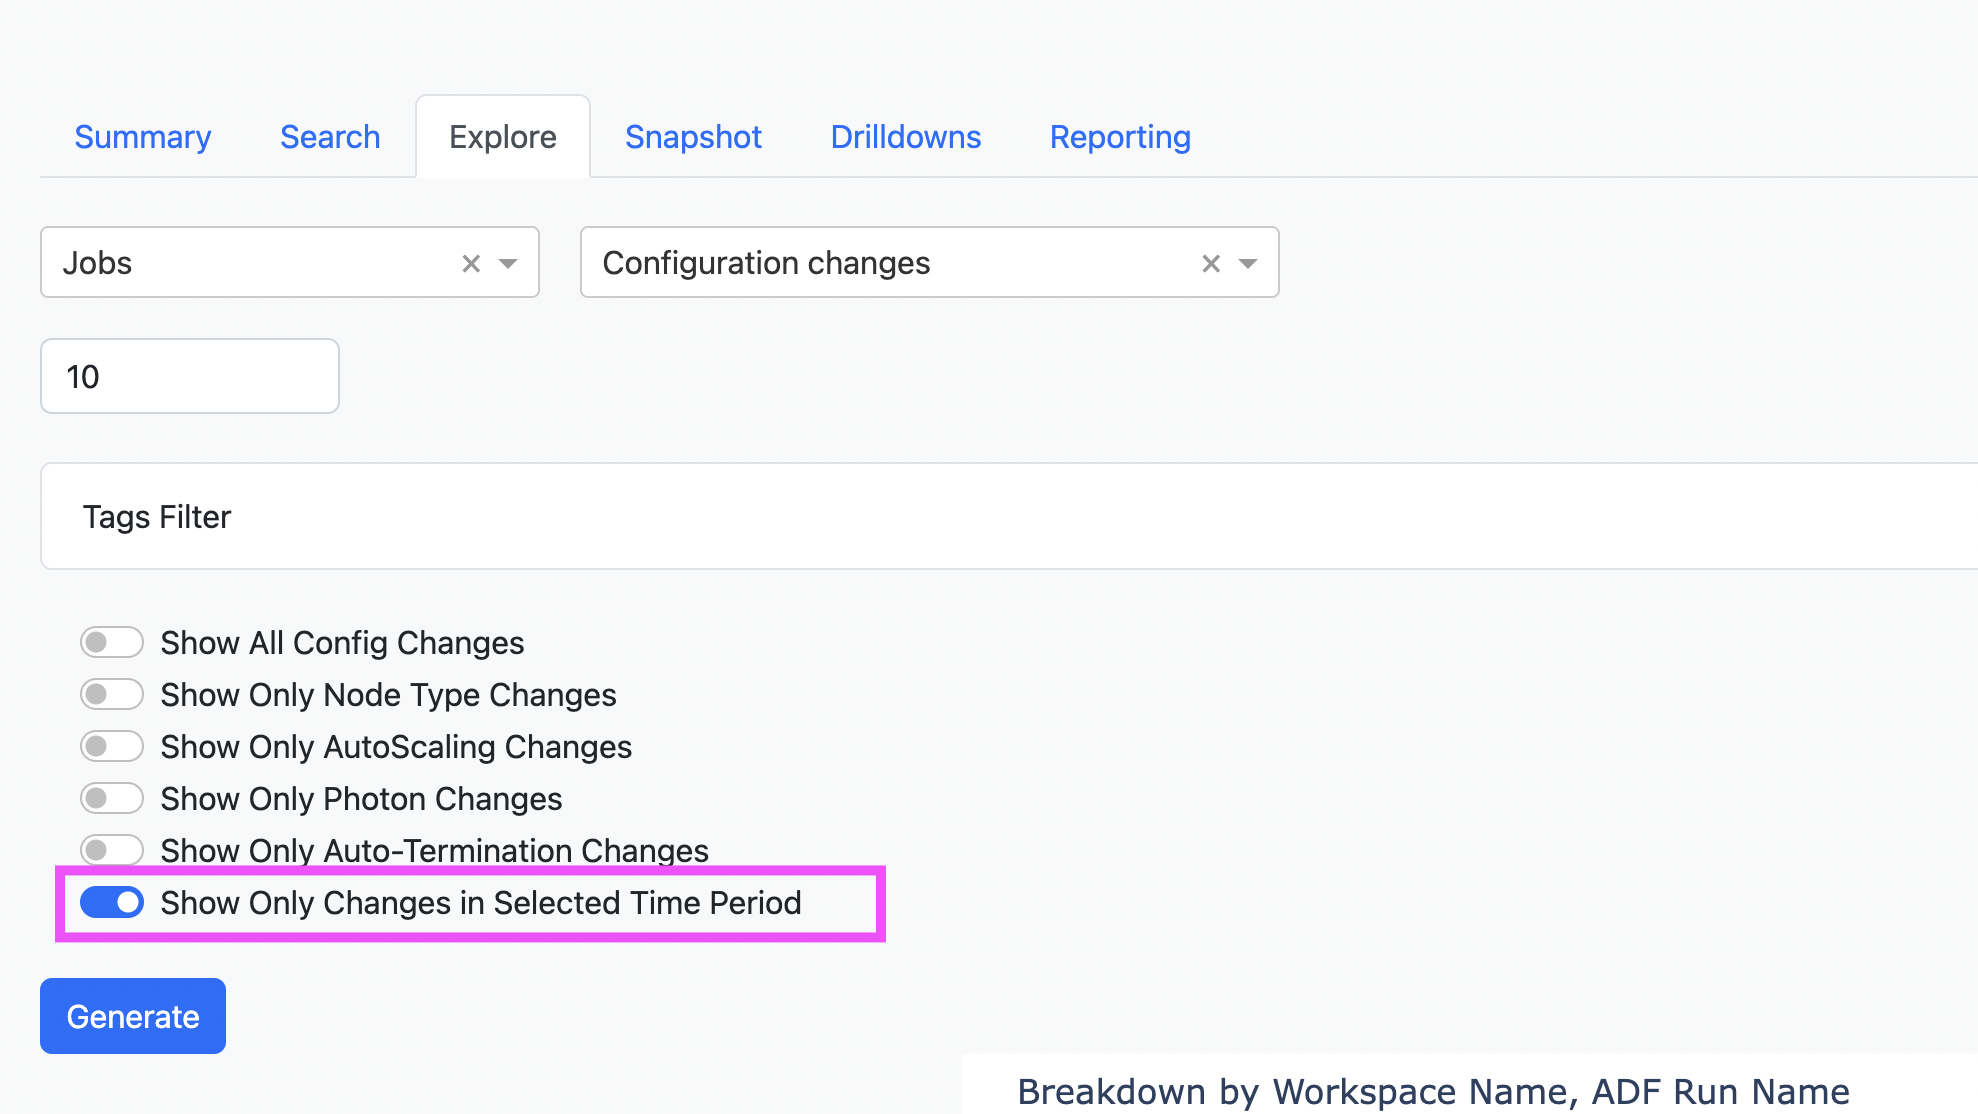
The Explore section lets you drill down into detailed savings insights. You can analyze change points, run counts, and savings per change point while filtering data by time frames and categories. You can also investigate specific signatures, cluster configurations, and job modifications that contributed to cost savings.
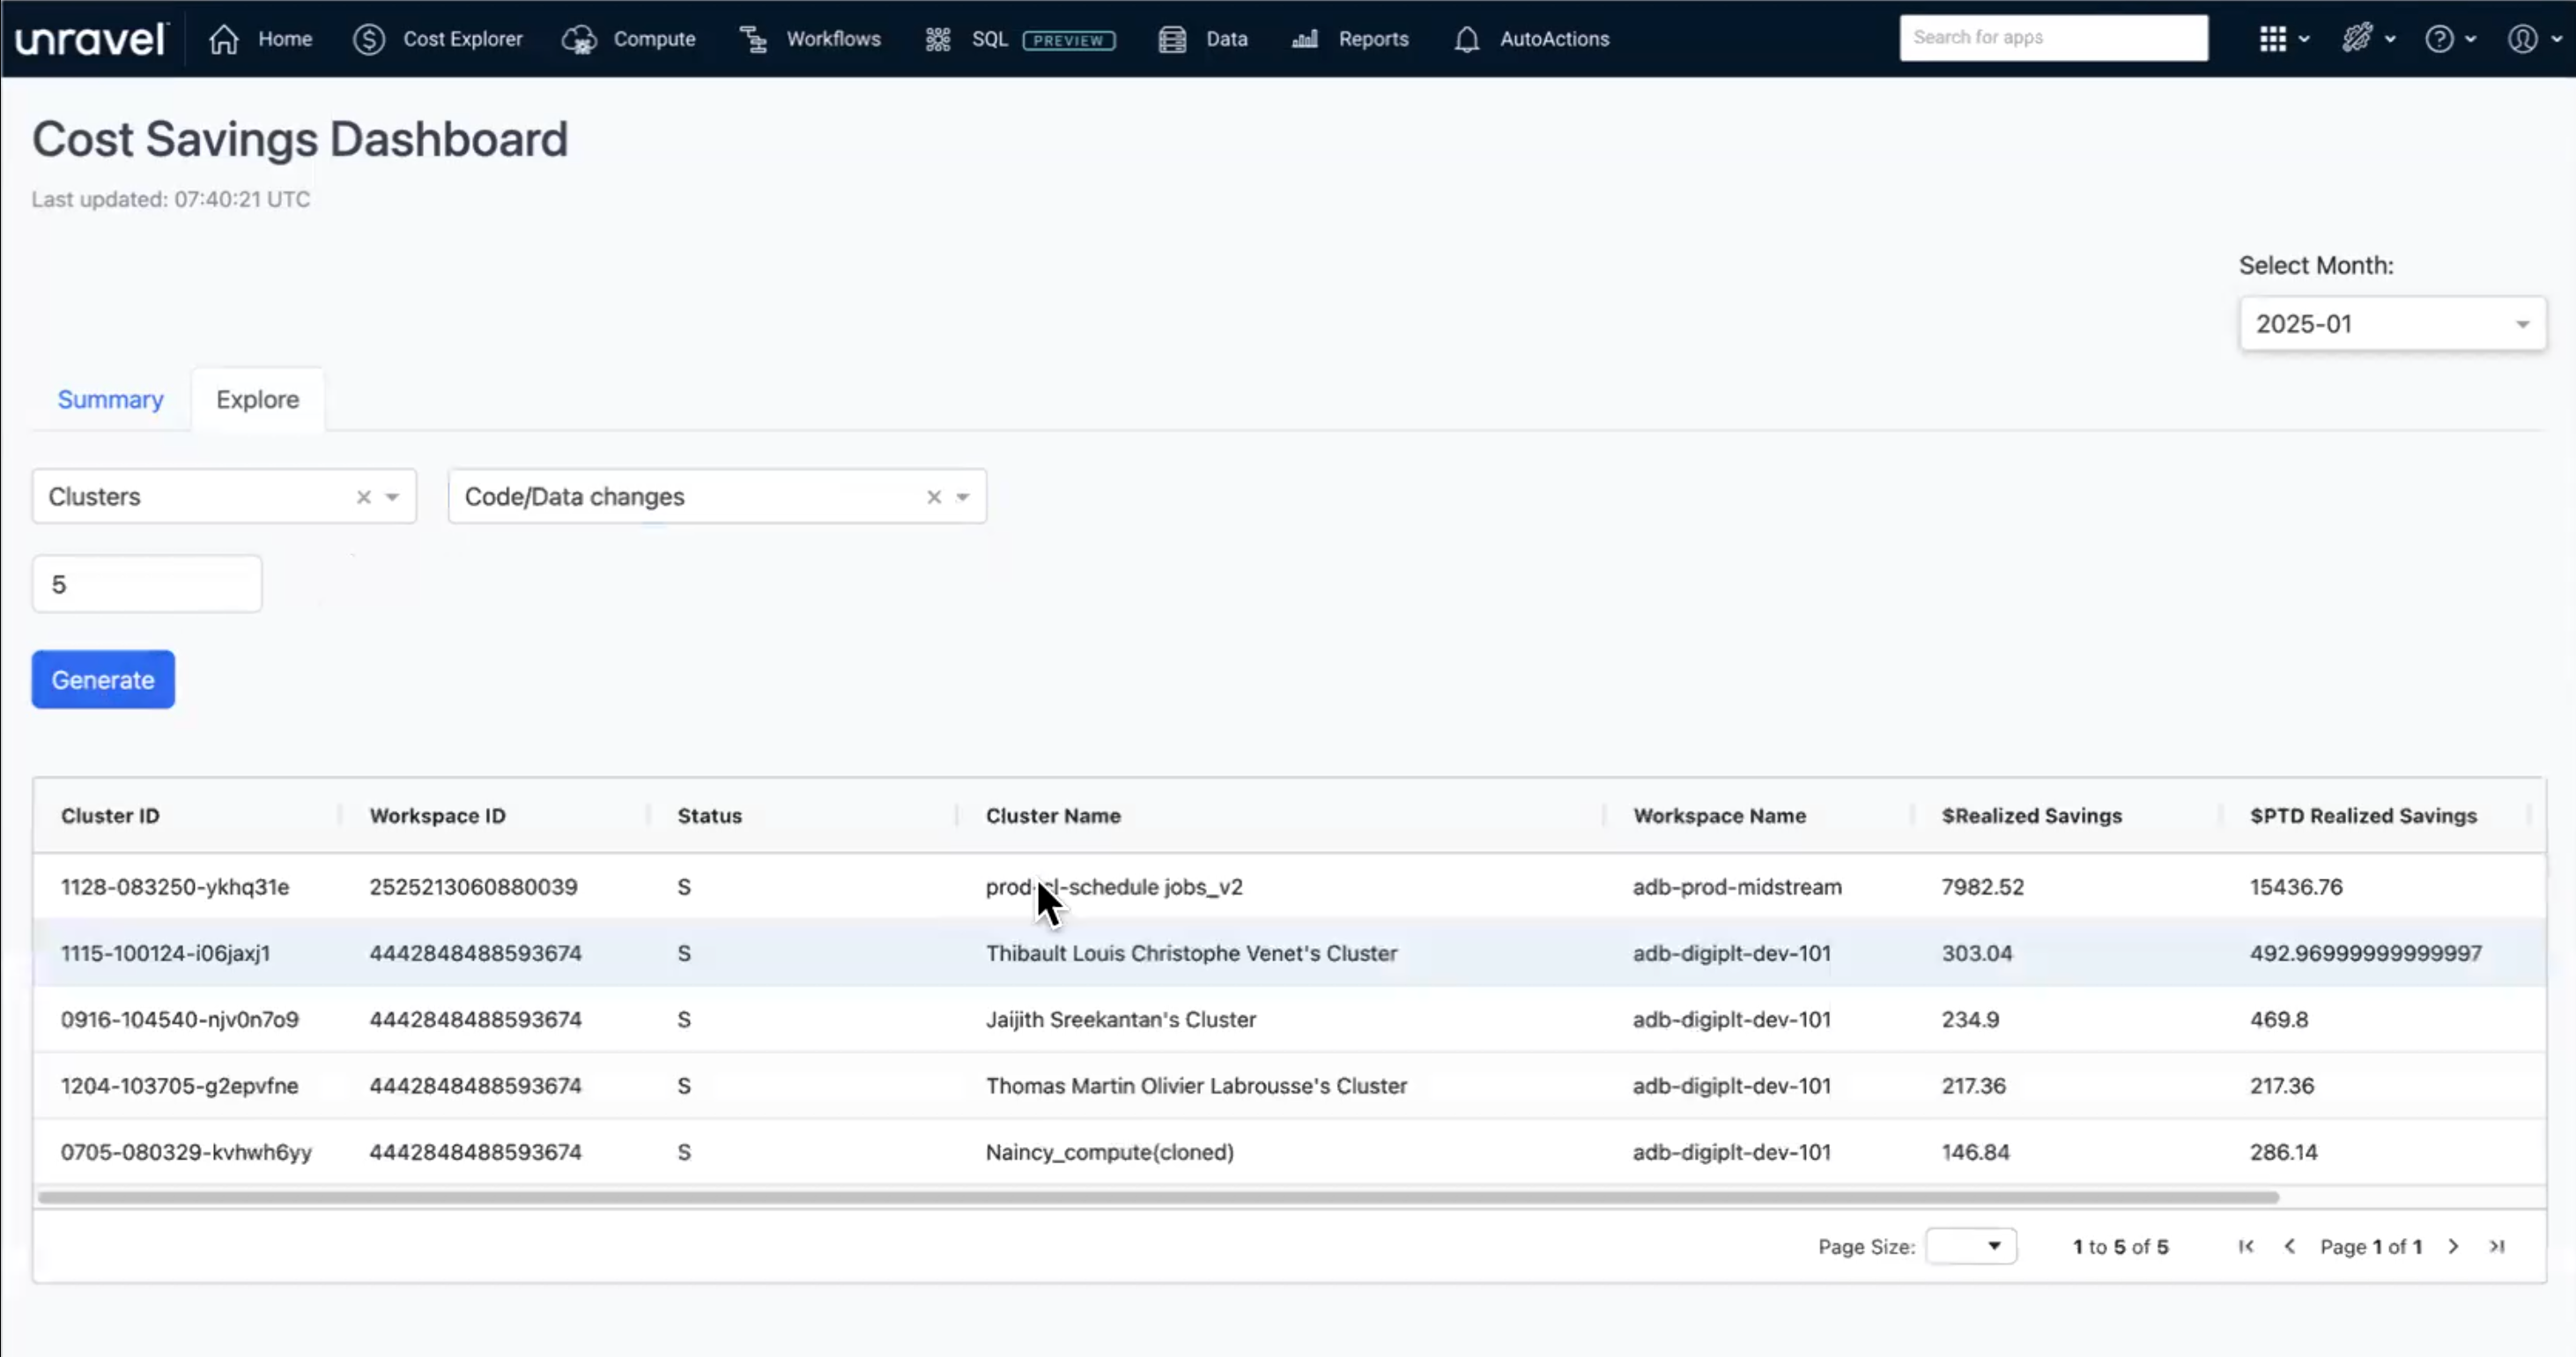
Savings data is available in a table or visual format. You can click a Cluster ID or Job ID for further analysis.
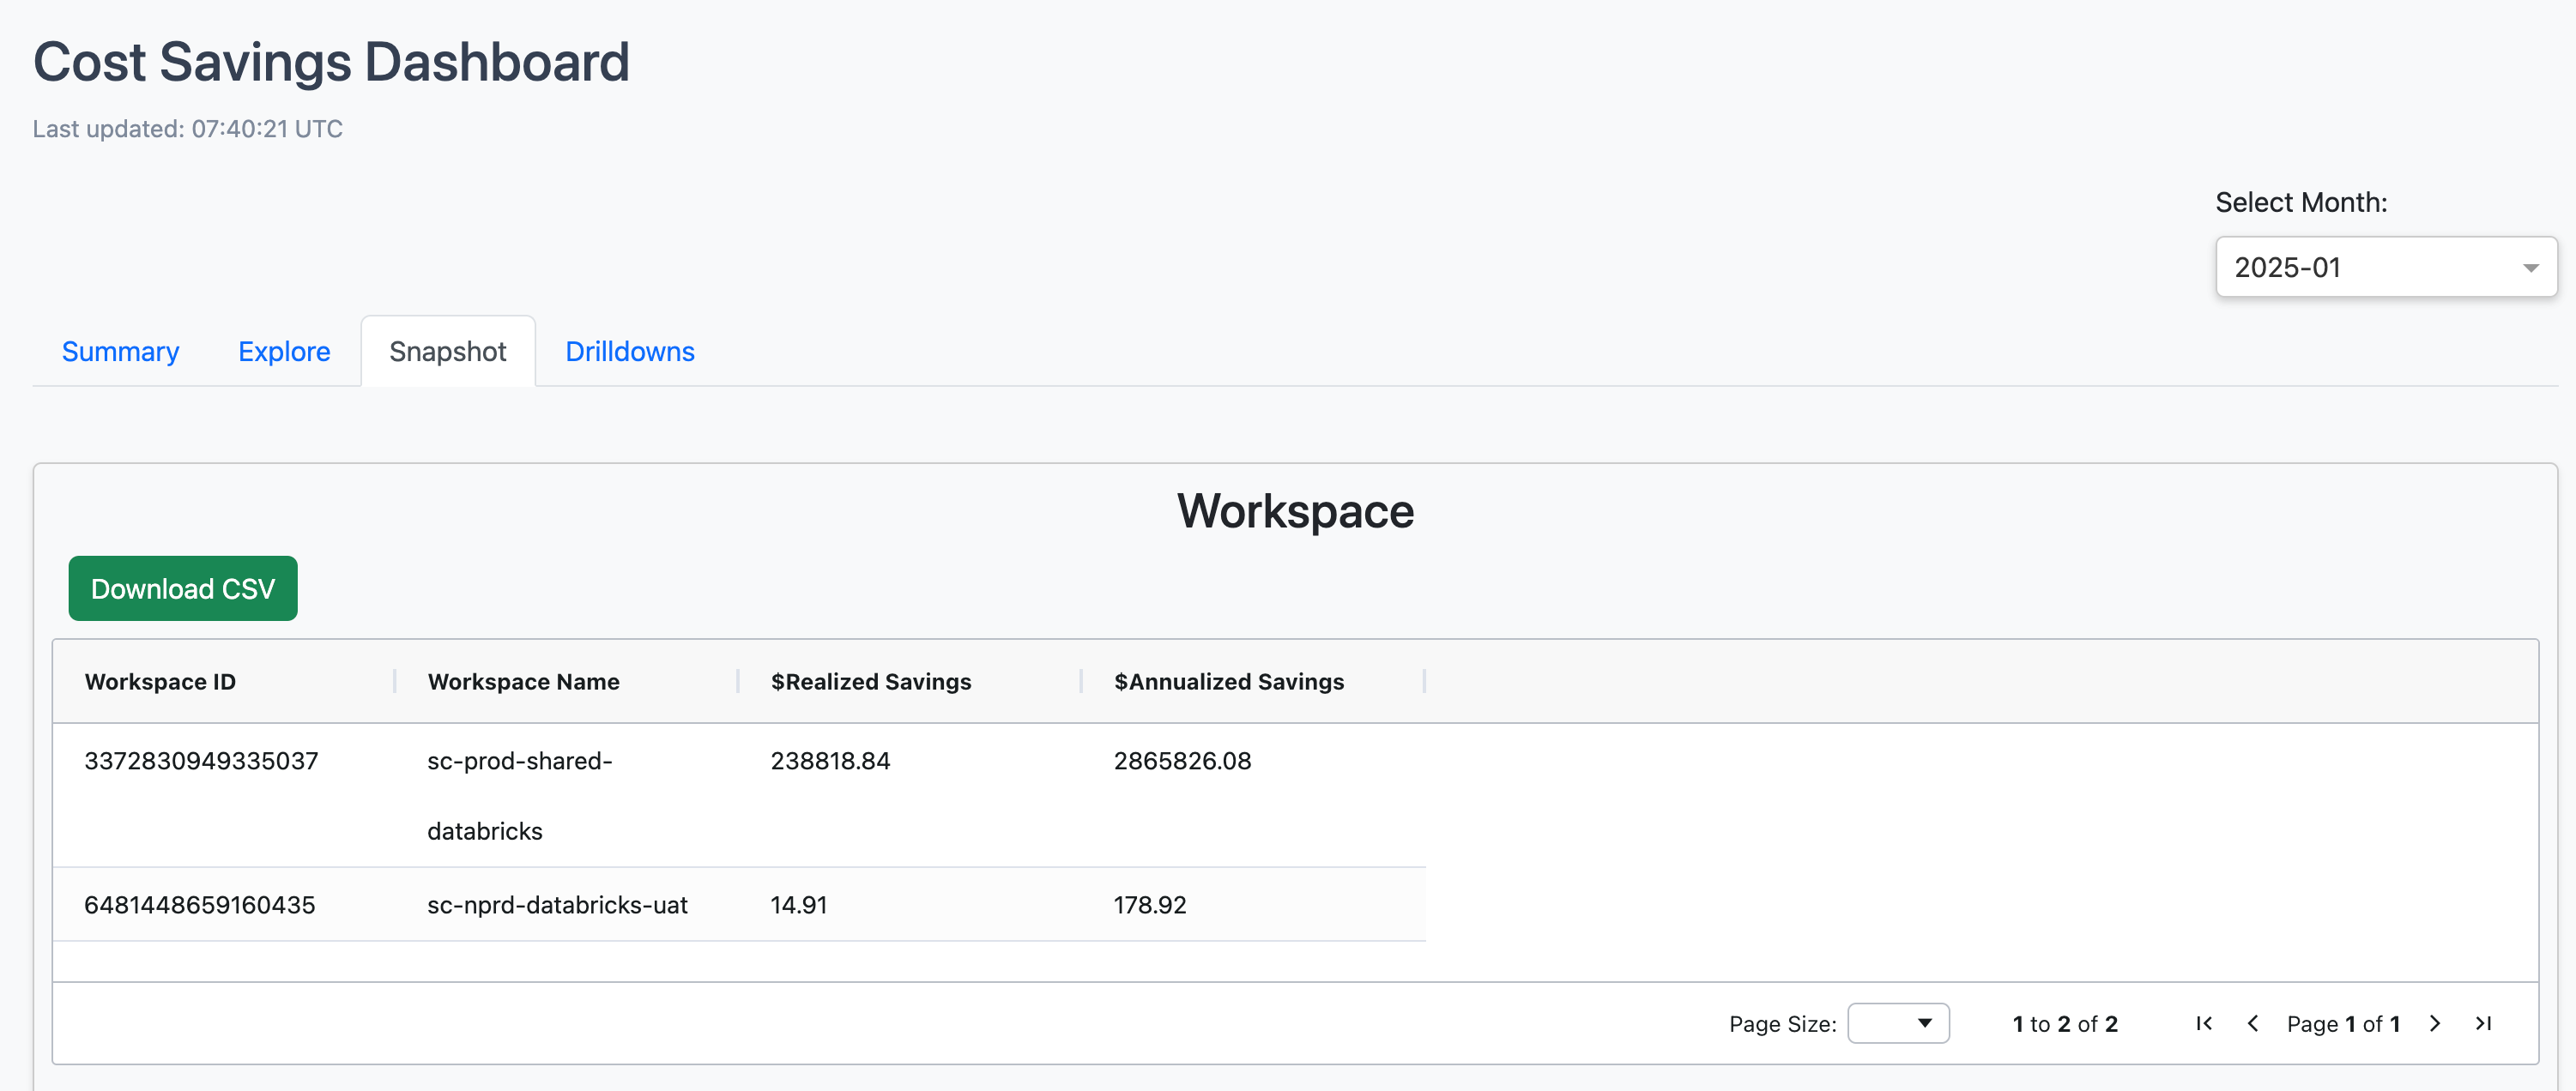
Snapshot
The Snapshot tab provides a high-level overview of cost savings across workspaces, jobs, and clusters in a tabular format. It includes Workspace ID, Workspace Name, Realized Cost, and Realized Savings, helping you compare cost savings across different workspaces and identify areas for further optimization.
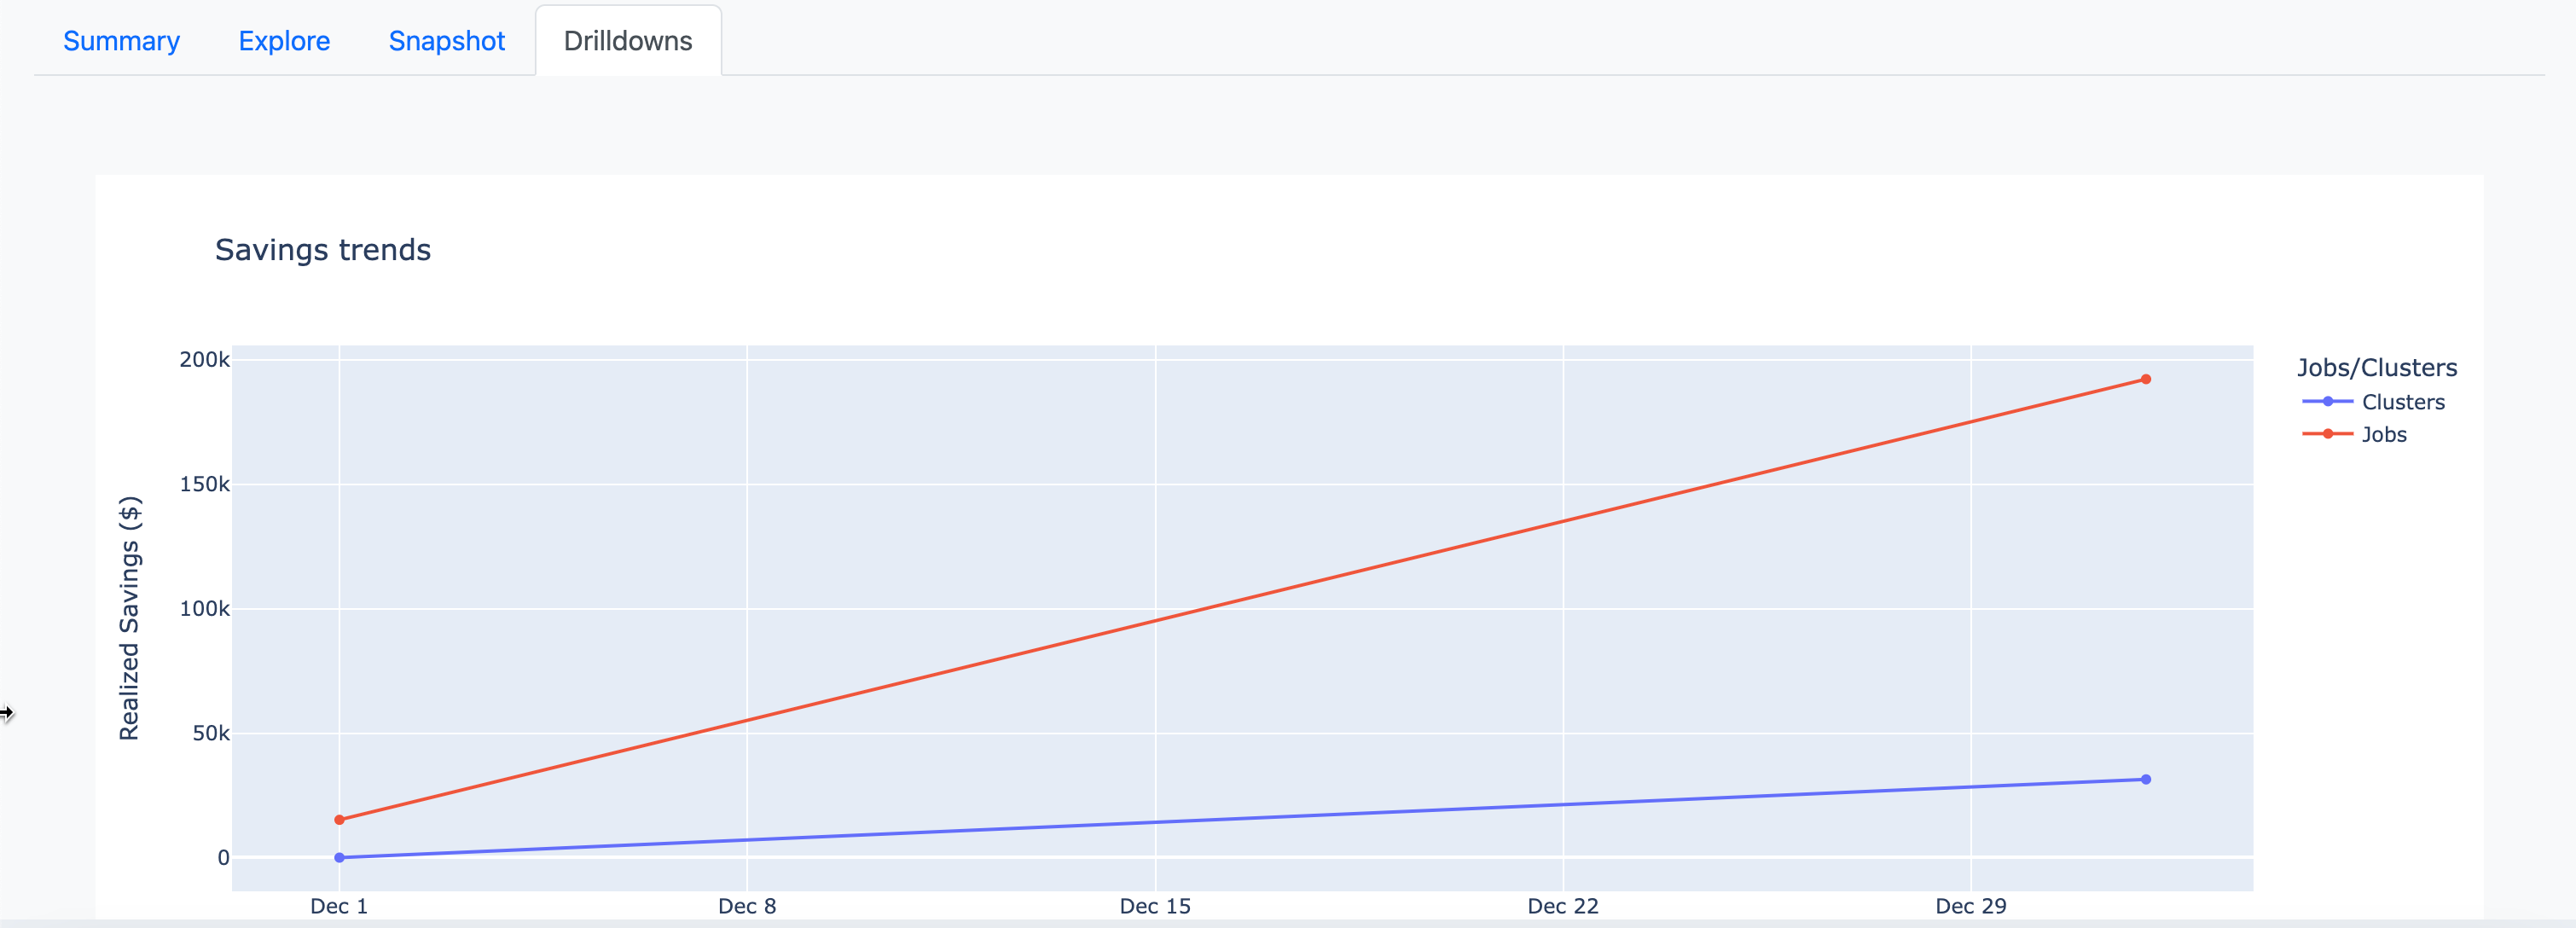
Drill-down
The Drill-Down tab provides a detailed analysis of cost savings by tracking realized savings over time, categorizing savings sources, and measuring the impact of configuration changes. You can explore savings at the job, cluster, and workspace levels to identify the most effective optimizations. Use the Show Only Changes in Selected Time Period toggle to limit the analysis to changes that occurred within the currently selected time range.
Savings Trends: Tracks realized savings over time for jobs and clusters, showing how changes—both recent and past—contribute to savings within the selected period. For example, a change made four months ago might contribute $1K in savings during the chosen timeframe. This helps you analyze how savings are distributed across implemented changes and measure the long-term impact of optimizations.
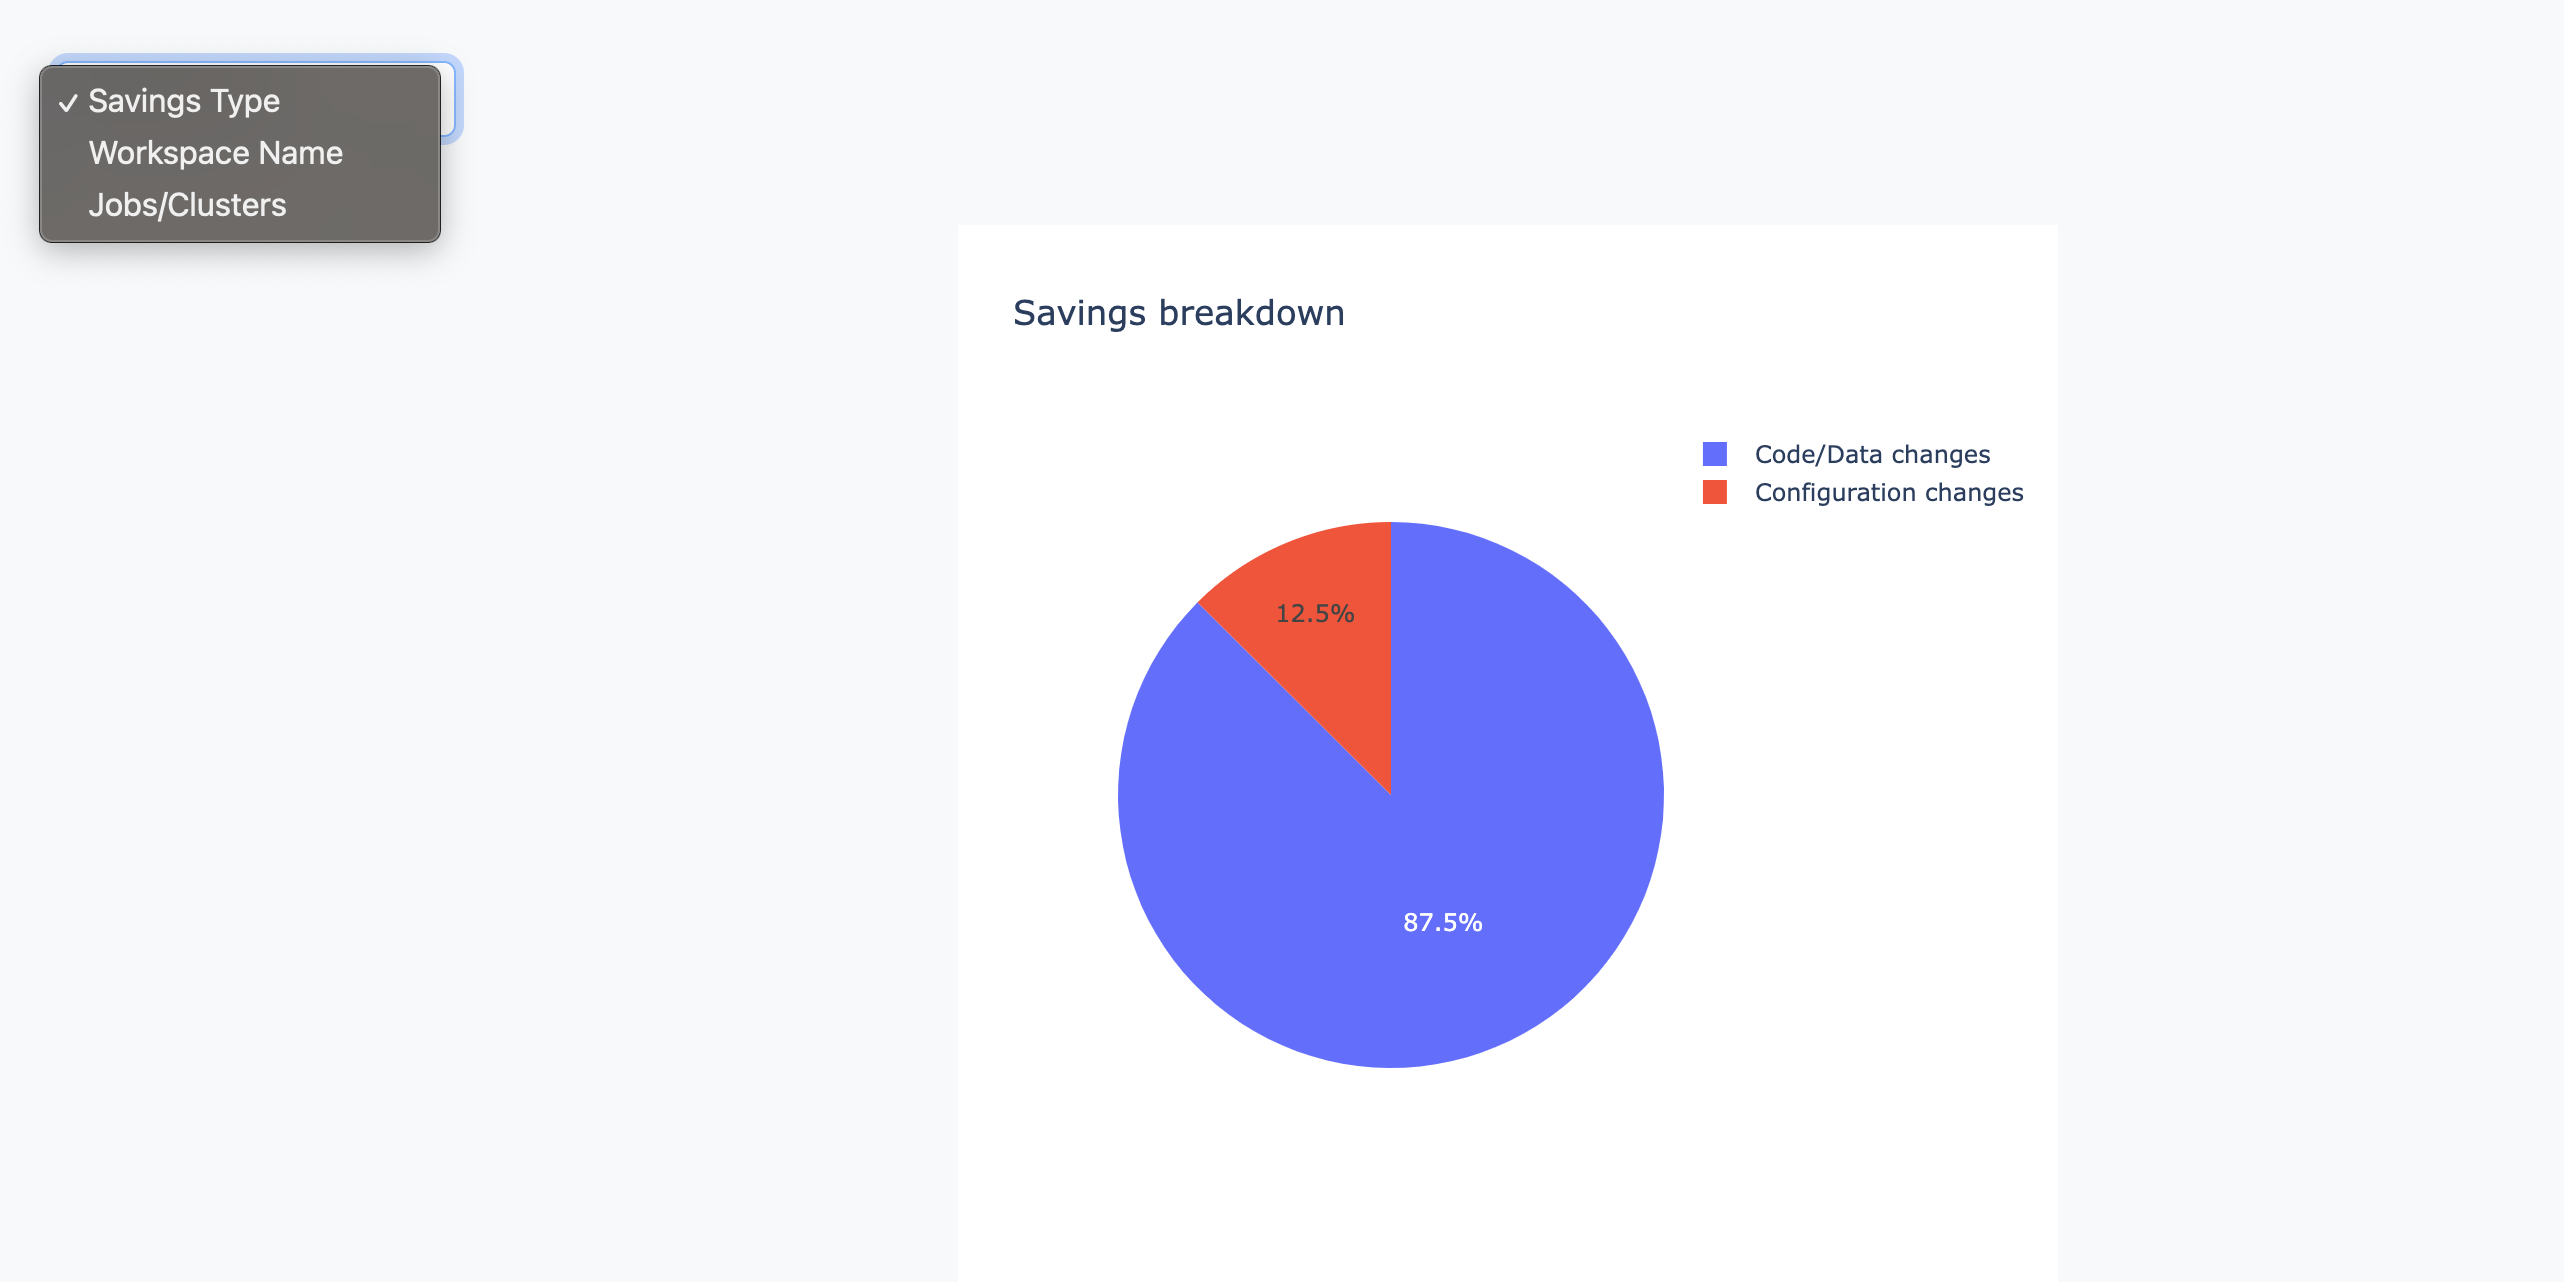
Savings Breakdown: Categorizes savings into code/data changes and configuration changes. You can filter by Savings Type, Workspace, or Jobs/Clusters to focus on key cost-saving opportunities.
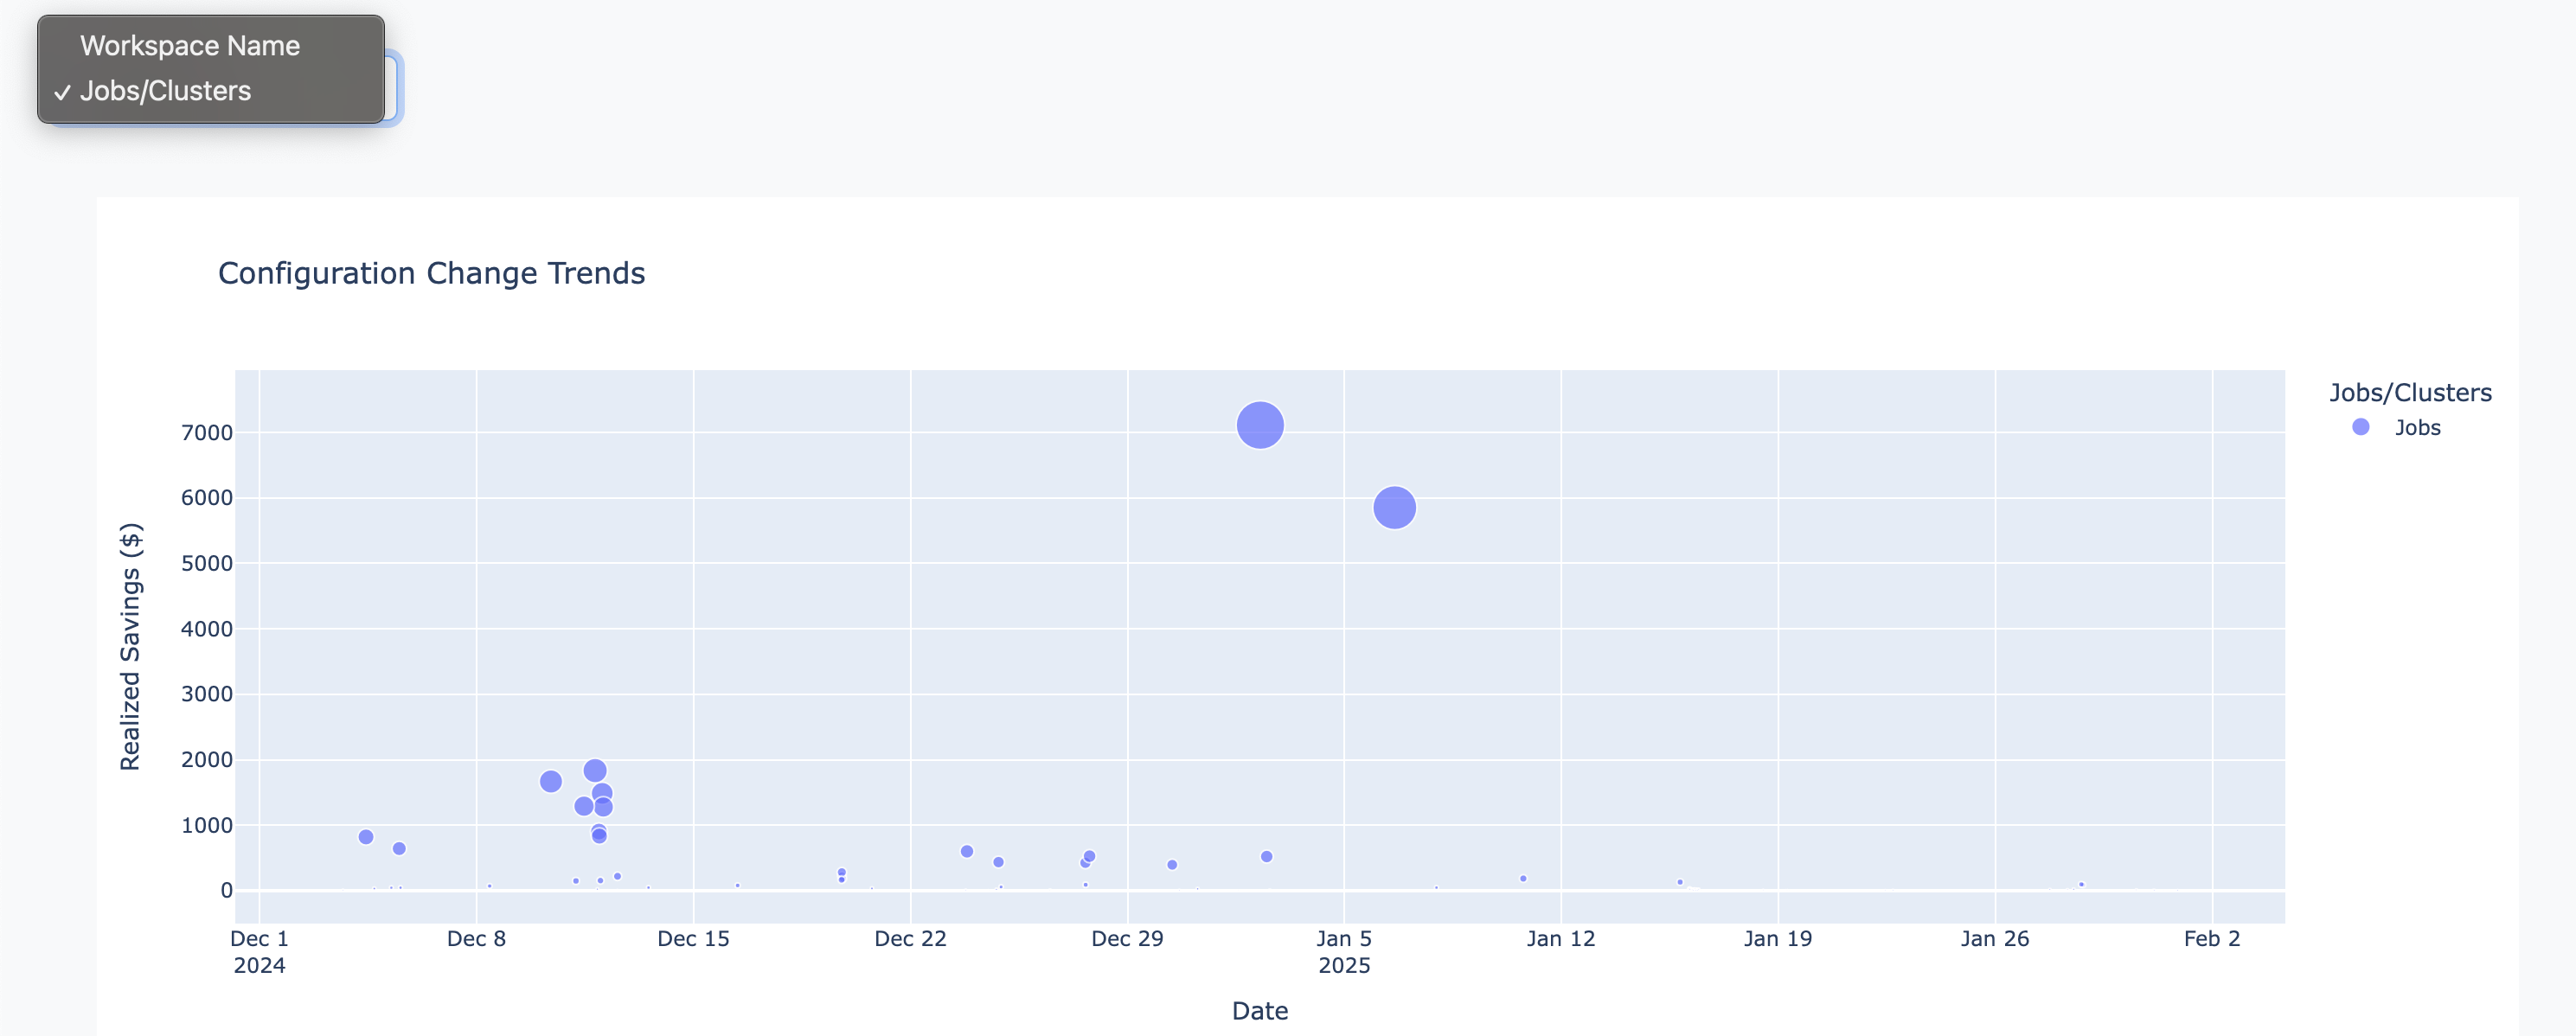
Configuration Change Trends: Tracks realized savings for jobs and clusters over time, allowing you to correlate cost reductions with configuration changes for jobs and All-Purpose clusters.
Reporting
The Reporting section lets you generate and export detailed cost savings reports for jobs and clusters. You can use these reports to share results with stakeholders, support budgeting and forecasting, and archive optimization outcomes.
To configure a report:
Select Report Type – Choose whether to report on Jobs or Clusters.
Select Change Type – Filter savings by Configuration Changes or Code/Data Changes.
Filter by Workspace – Include all workspaces or limit the report to specific workspaces.
After you set your filters, select Generate Report to create the report view. The generated report shows summary metrics such as total realized savings, annualized savings, savings from selected period changes, number of signatures, and number of workspaces included.
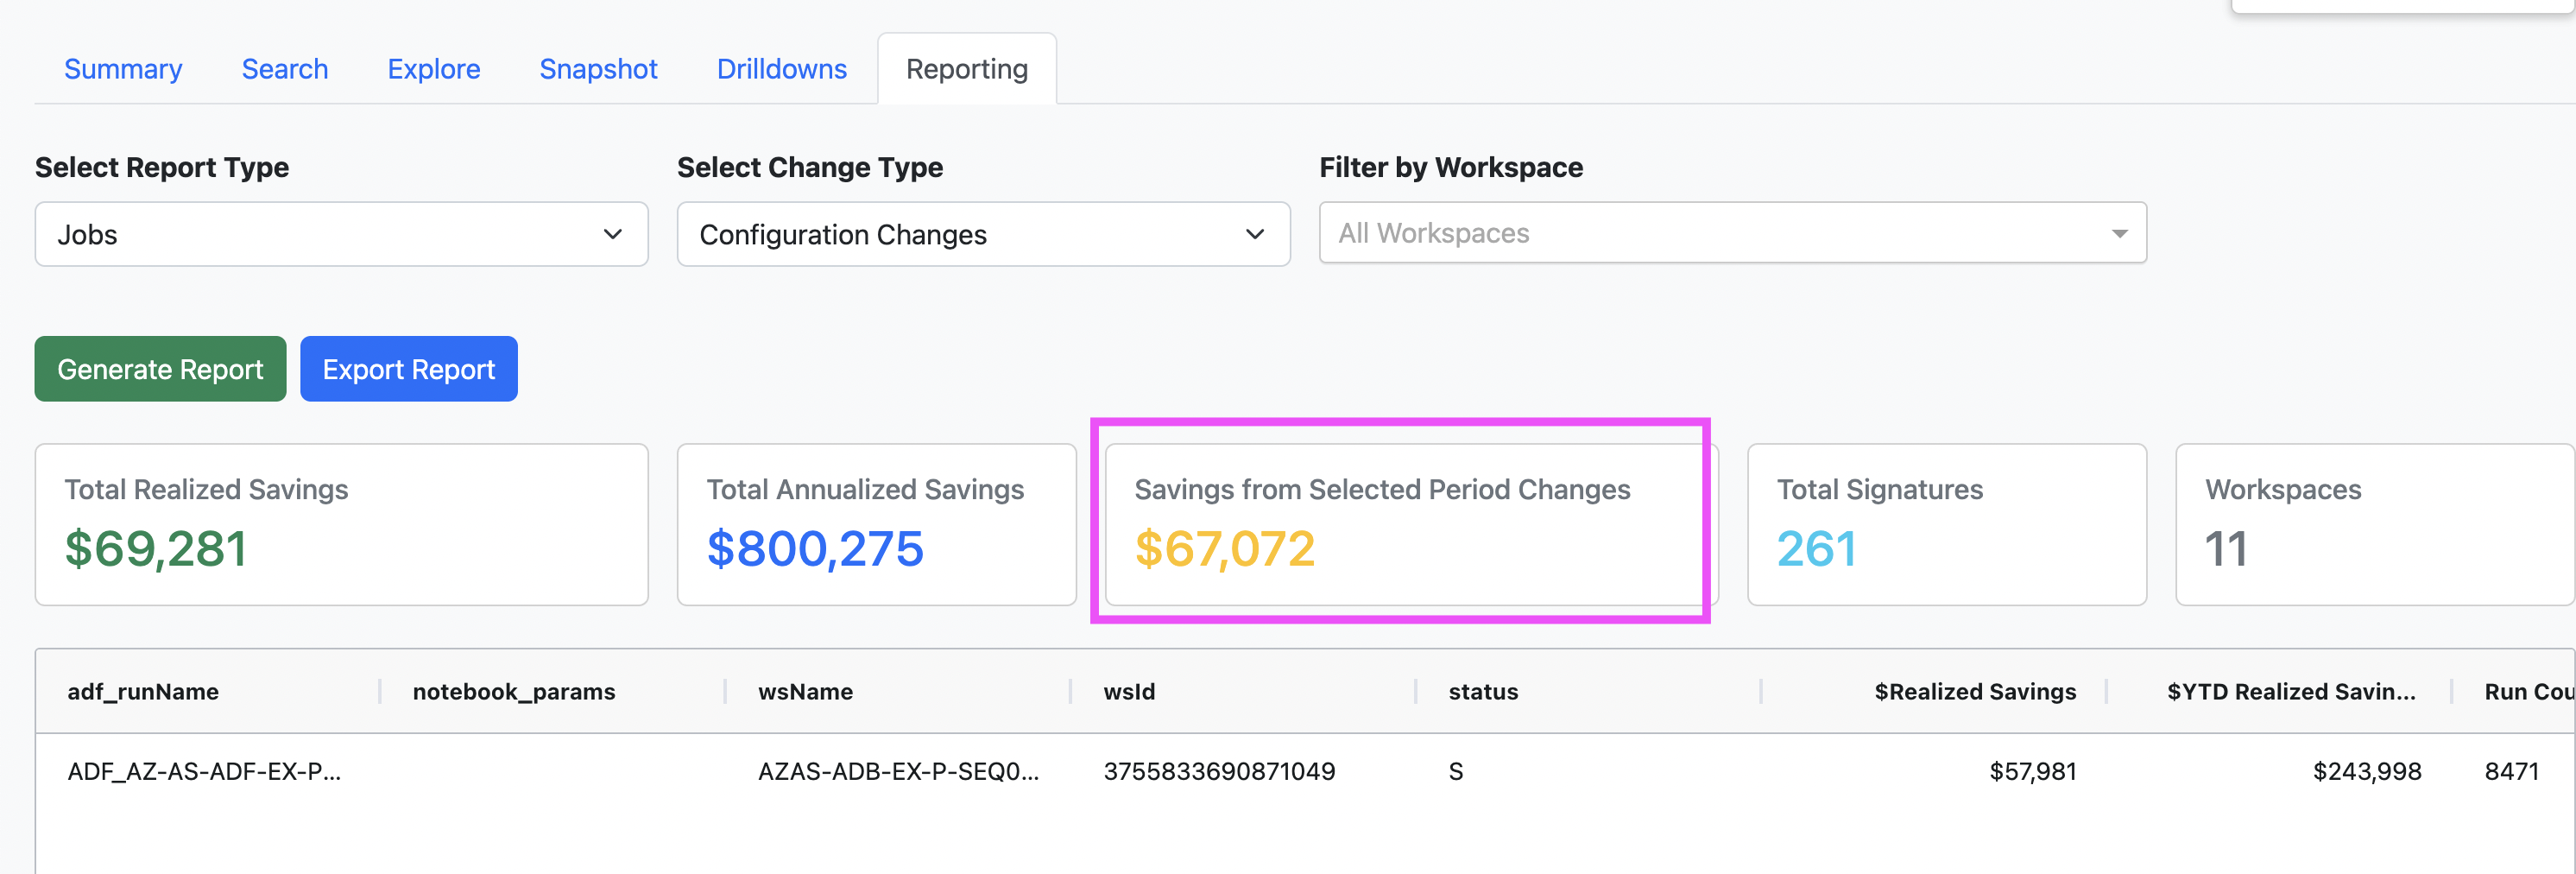
Below the summary metrics, a detailed table lists individual records with identifiers (such as job or cluster IDs, workspace information, and run status) and their associated realized and annualized savings. You can select Export Report to download the report as a CSV file for further analysis or sharing.