Workspace Dashboard
Overview
The Workspace Dashboard is a centralized management and optimization tool for multi-workspace Databricks environments. It bridges the gap between raw configuration data and operational insights by aggregating workspace metadata, cluster configurations, and cost-optimization recommendations into a single interface.
A common challenge in Databricks environments is "idle waste," where clusters remain active without workloads because users set arbitrary auto-termination limits. The Workspace Dashboard addresses this by allowing administrators to view cluster events and configurations grouped by specific Autotermination time buckets, making it easier to prioritize optimization efforts across the organization.
Key features
Auto-termination bucketing: Filter and group clusters by recommended idle-time buckets (such as 45 or 60 minutes) to identify the highest areas of waste.
Proactive token monitoring: Track Token Expiry dates across all workspaces. The dashboard automatically flags tokens expiring in less than 30 days with a warning (⚠️) to prevent service disruptions.
Unified inventory: View a "bird’s-eye view" of your entire Databricks estate, including instance URLs, subscription tiers, and SQL monitoring status.
LTS version analysis: Identify the distribution of Databricks Runtime versions across your automated and interactive clusters to plan upgrades effectively.
Data sources and architecture
The dashboard aggregates data from three primary sources to ensure accuracy and real-time relevance:
unravel.properties: Serves as the source of truth for workspace IDs, instance URLs, and encrypted credentials.
Databricks REST API (v2.0/v2.1): Fetches real-time cluster configurations and token metadata directly from your workspaces.
Elasticsearch (Unravel Backend): Queries ev-* indices to retrieve historical event data and output from the Unravel recommendation engine.
Example use case
Imagine you are a platform administrator managing several Databricks workspaces for different departments. You can use the Workspace Dashboard to perform a weekly health check:
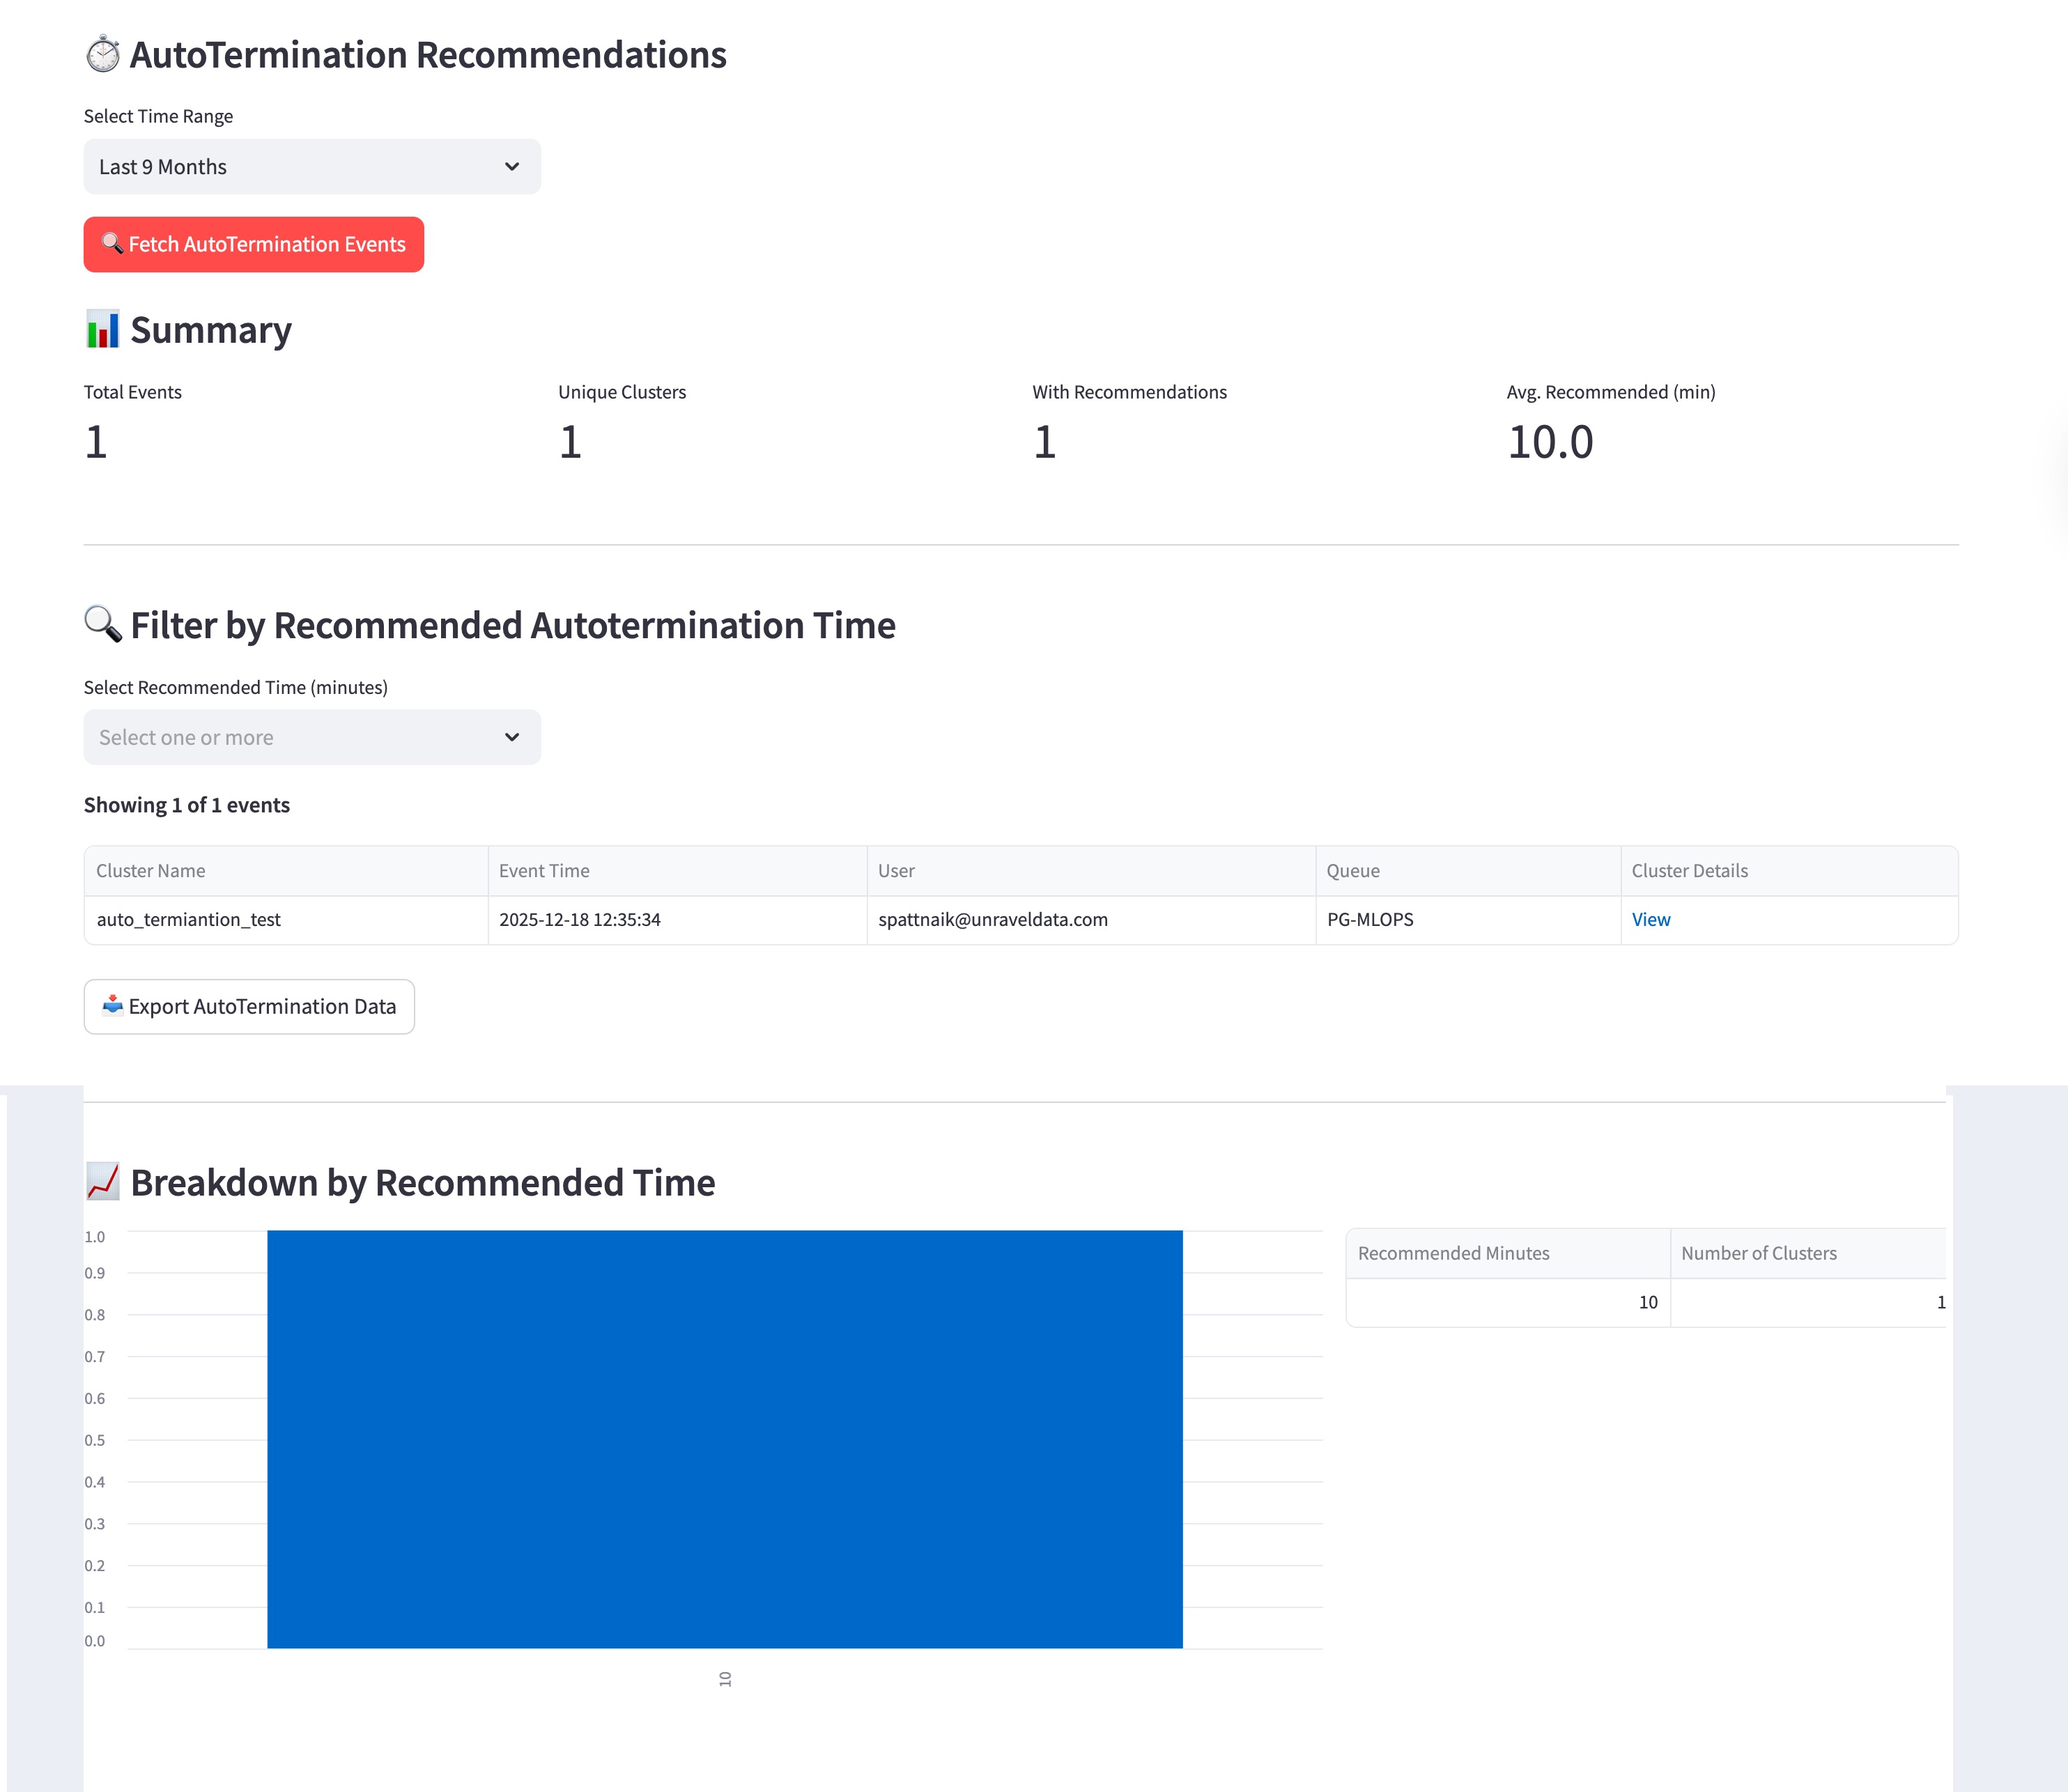
Identify waste: You navigate to the AutoTermination Recommendations section and discover that one cluster has a recommended idle time of 10.0 minutes based on its usage history.
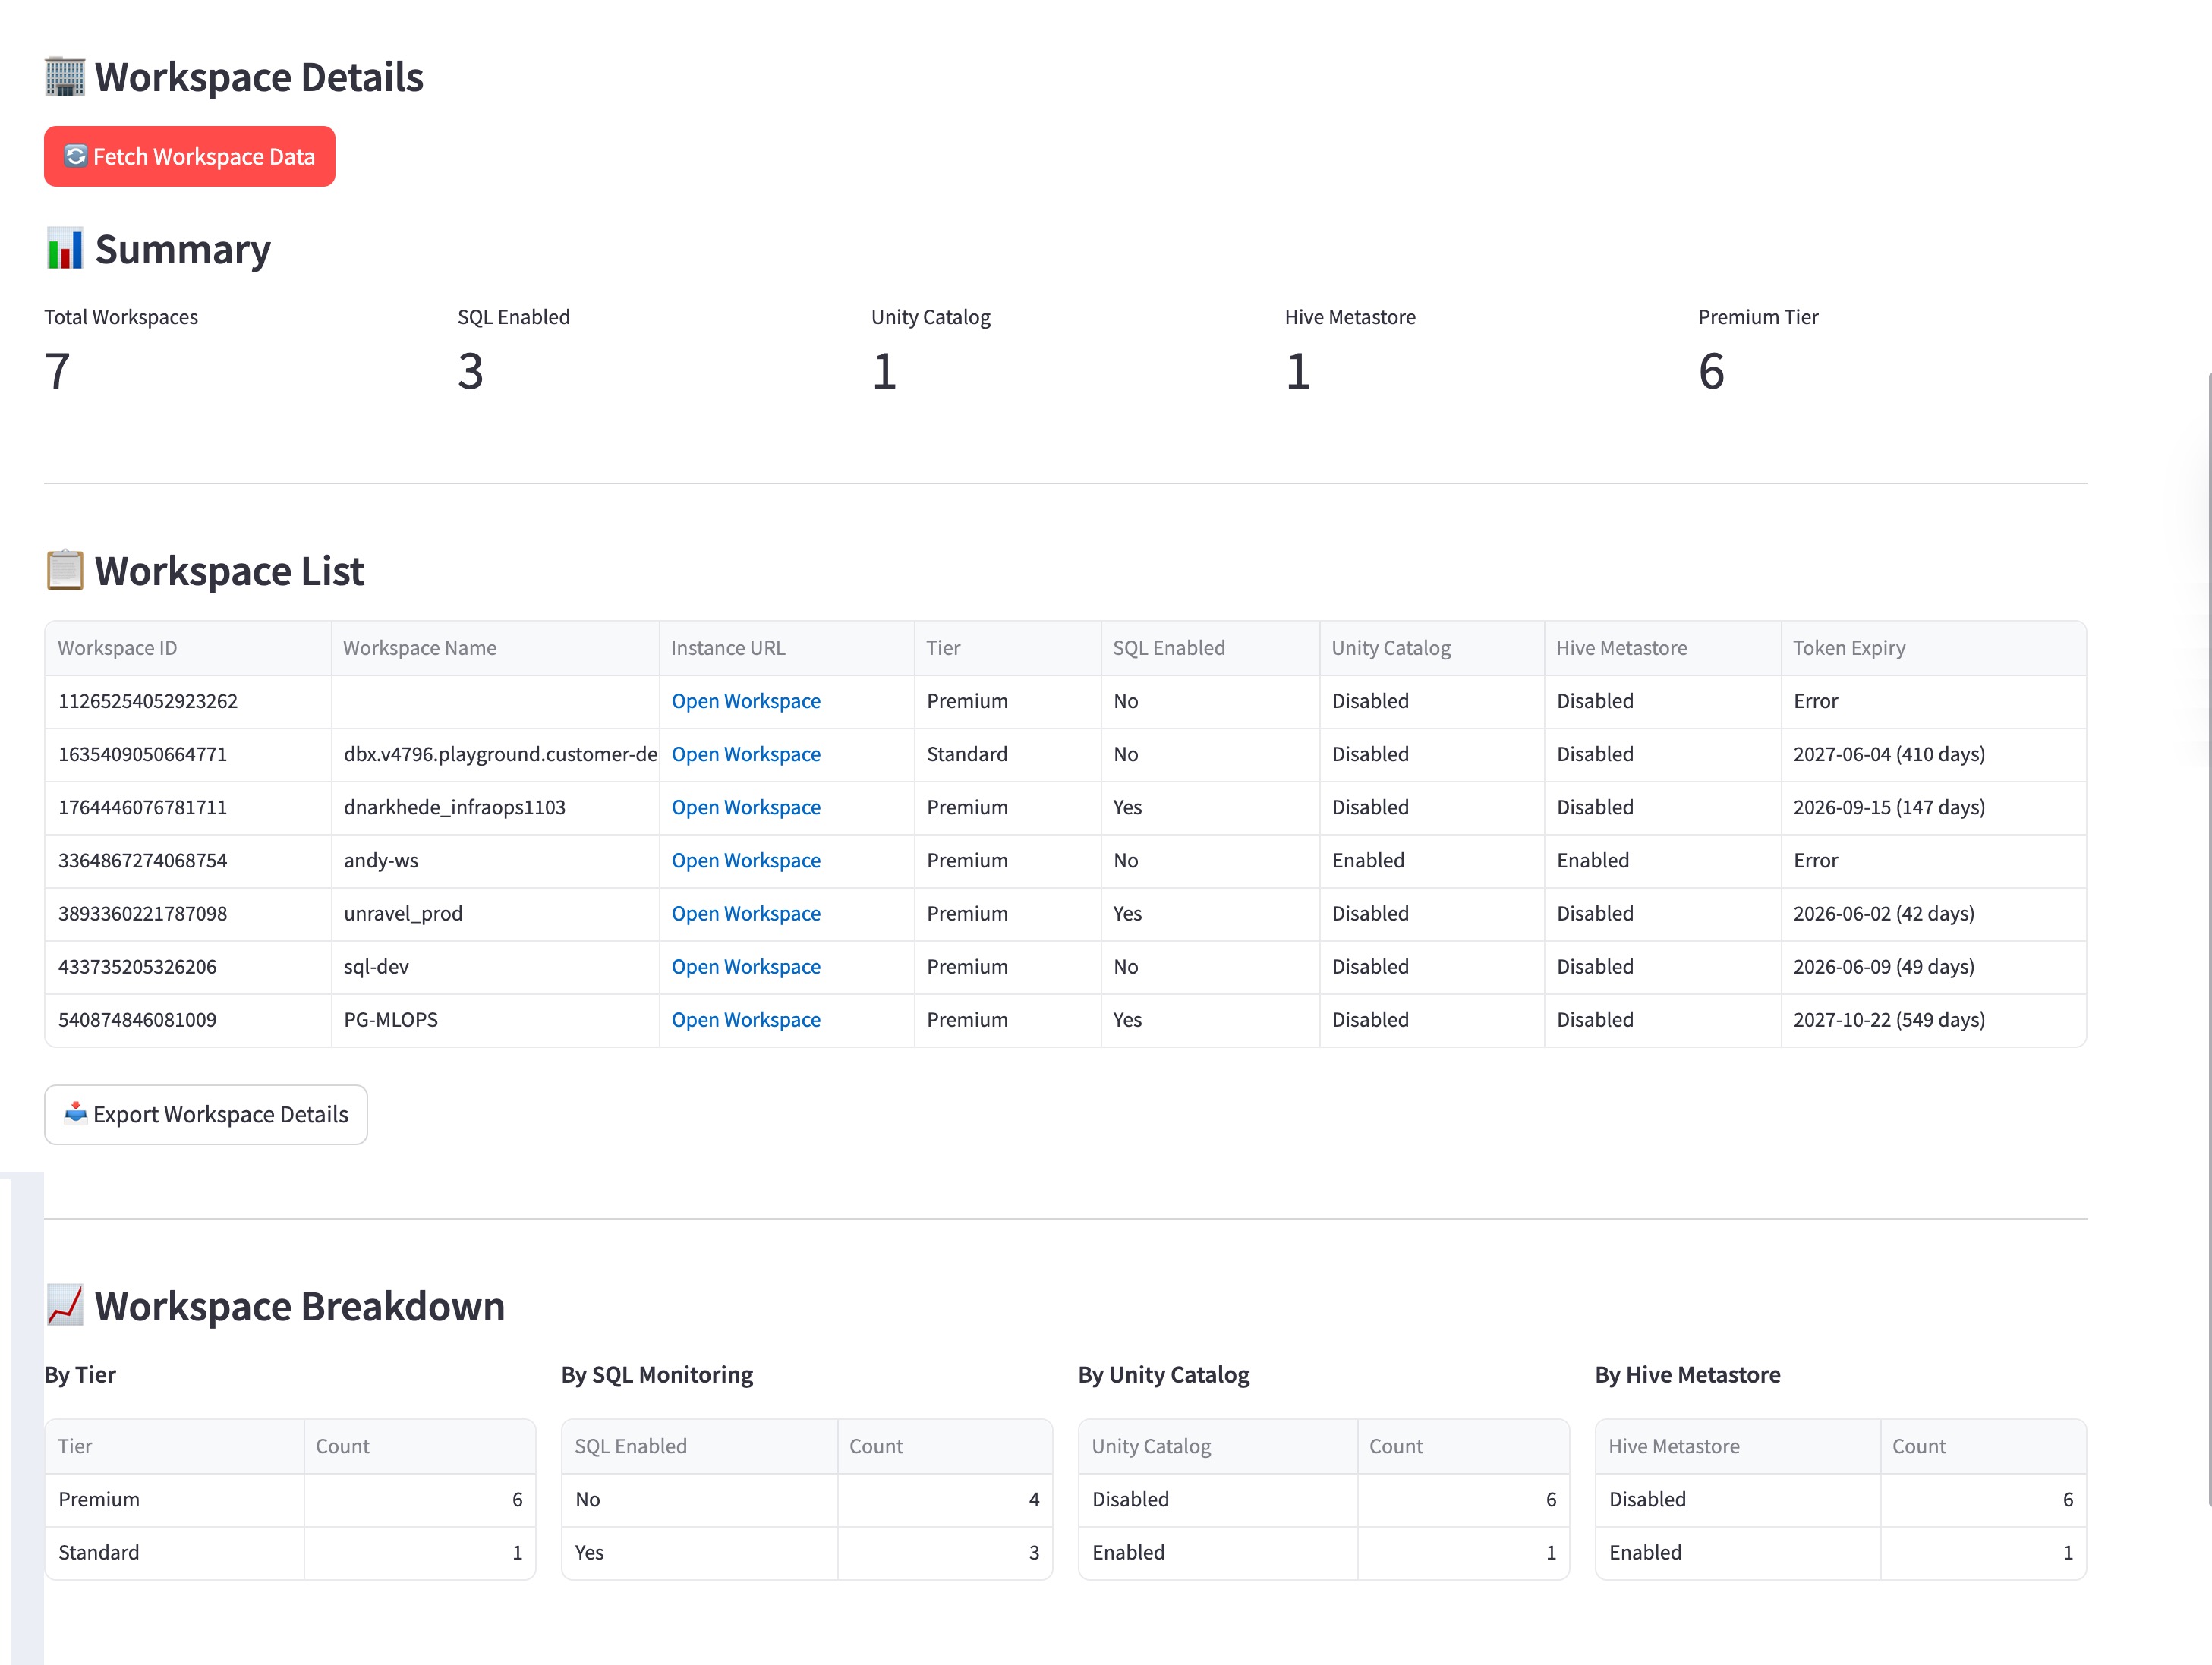
Ensure compliance: You switch to the Workspace Details view and notice that out of 7 workspaces, only 3 have SQL enabled. You also check the Token Expiry column to identify which workspace tokens are expiring soonest to avoid service disruptions.
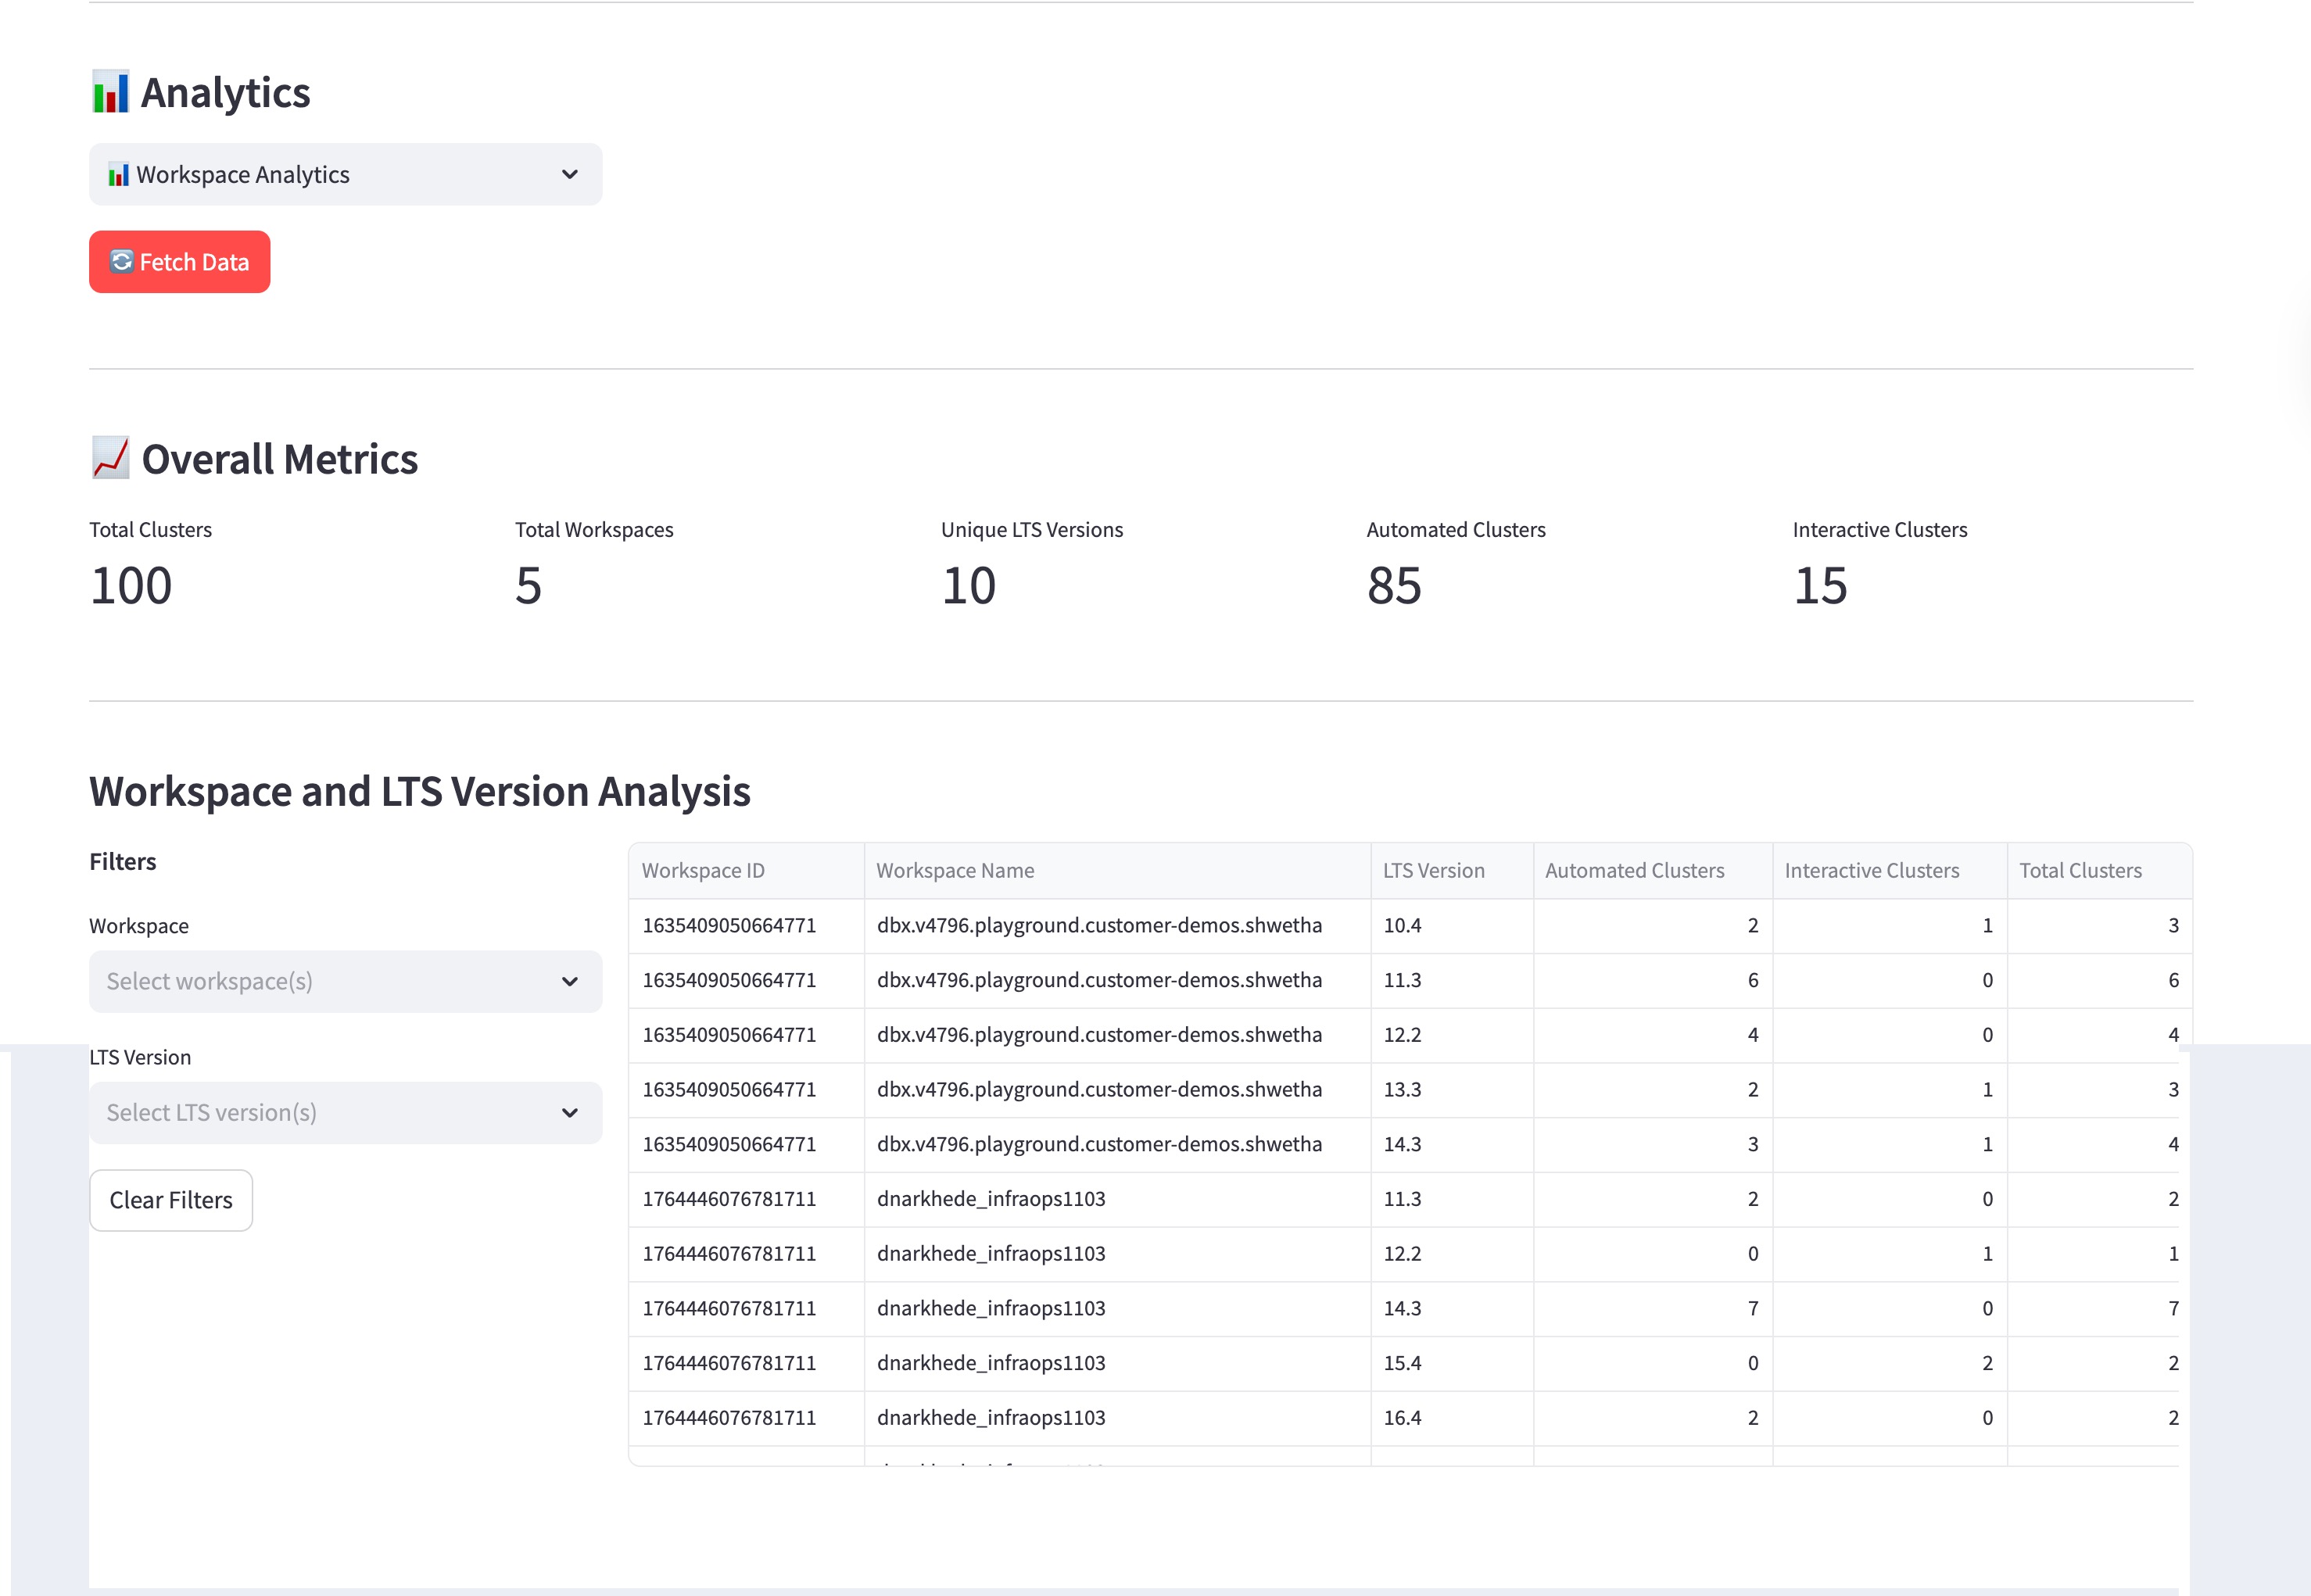
Plan maintenance: You open the Analytics view and see that you have 10 unique LTS versions across 100 clusters. You use the Workspace and LTS Version Analysis table to find clusters running older versions (like 10.4) and schedule them for migration to a newer supported runtime.
Installing and accessing the app
For instructions on how to install and access the app, refer to Installing and accessing the app.
Using the app
The Workspace Dashboard is divided into three functional areas to help you manage different aspects of your environment.
AutoTermination Recommendations
Use this section to find and fix inefficient idle settings.
Fetch Data: Select the Fetch AutoTermination Events button to pull the latest insights from the recommendation engine.
Filter by Bucket: Use the Select Recommended Time (minutes) multiselect filter. By selecting specific buckets like 45 or 60, you can isolate clusters that are currently configured with excessive idle limits.
Review Visuals: Use the bar charts to see a breakdown of recommended times across your environment.
Summary tiles: View at a glance how many Unique Clusters have active recommendations and the Avg. Recommended (min) for your environment.
Breakdown chart: Use the Breakdown by Recommended Time bar chart to see the distribution of idle-time suggestions.
Workspace Details
This section provides an inventory of your Databricks configuration.
Metadata Tracking: Review the table to see which workspaces are Premium or Standard, and which have SQL Monitoring or Hive Metastores active.
Token Management: Monitor the Token Expiry column. If you see a ⚠️ emoji, plan to rotate that token within the next 30 days to maintain connectivity.
Visual breakdown: View donut charts and tables that categorize your environment By Tier, By SQL Monitoring, and other key settings.
Analytics
This section analyzes the technical runtime details and distribution of your compute resources. The Analytics section provides two distinct lenses for reviewing your compute resources:
Compute metrics: Track the number of Automated Clusters versus Interactive Clusters across all selected workspaces.
Analytics filters: Use the filters to narrow your analysis by:
Workspace Analytics: Focus on how resources are distributed within a specific workspace.
Cluster Analytics: Perform a technical deep-dive into cluster configurations. You can filter by:
LTS Version: Identify clusters running on outdated runtimes.
Security Mode: Check for compliance between Single User and Shared access modes.
Runtime Engine: See the distribution of Photon versus Standard engines to track performance adoption.
Detailed analysis: Review the Workspace and LTS Version Analysis table to identify exactly which workspaces are running which runtime versions and the count of each cluster type associated with them.