Cost and Warehouse Load Detail
Access more detailed information about a specific warehouse from the warehouse detail page. This page offers interactive insights into total compute cost, cloud service cost, and warehouse load over time.
Viewing the cost detail
From the Unravel UI, select Warehouses. The Warehouses page is displayed.
Scroll down to the Warehouses list.
Click the required Warehouse to display the warehouse detail page.

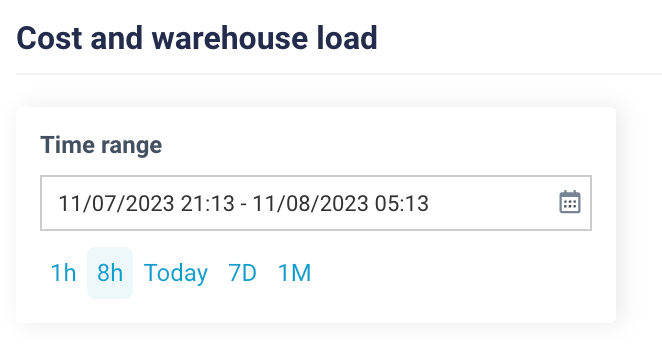
Use the date picker to select a required time range. You can also select the default time ranges of 1 hour, 8 hours, Today, 7 days, or 1 month. The Cost and Load trend for the warehouse is displayed for the selected time range. You can view the Warehouse Cost, Total Compute Cost, Cloud Services Cost, and Warehouse load over time.

Scroll down to view the cost trend.

Viewing the warehouse load detail
From the Unravel UI, select Warehouses. The Warehouses page is displayed.
Scroll down to the Warehouses list.
Click the required Warehouse to display the warehouse detail page.

Use the date picker to select a required time range. You can also select the default time ranges of 1 hour, 8 hours, Today, 7 days, or 1 month. The Cost and Load trend for the warehouse is displayed for the selected time range. You can view the Warehouse Cost, Total Compute Cost, Cloud Services Cost, and Warehouse load over time.

Scroll down to view the Warehouse load over time trend.
