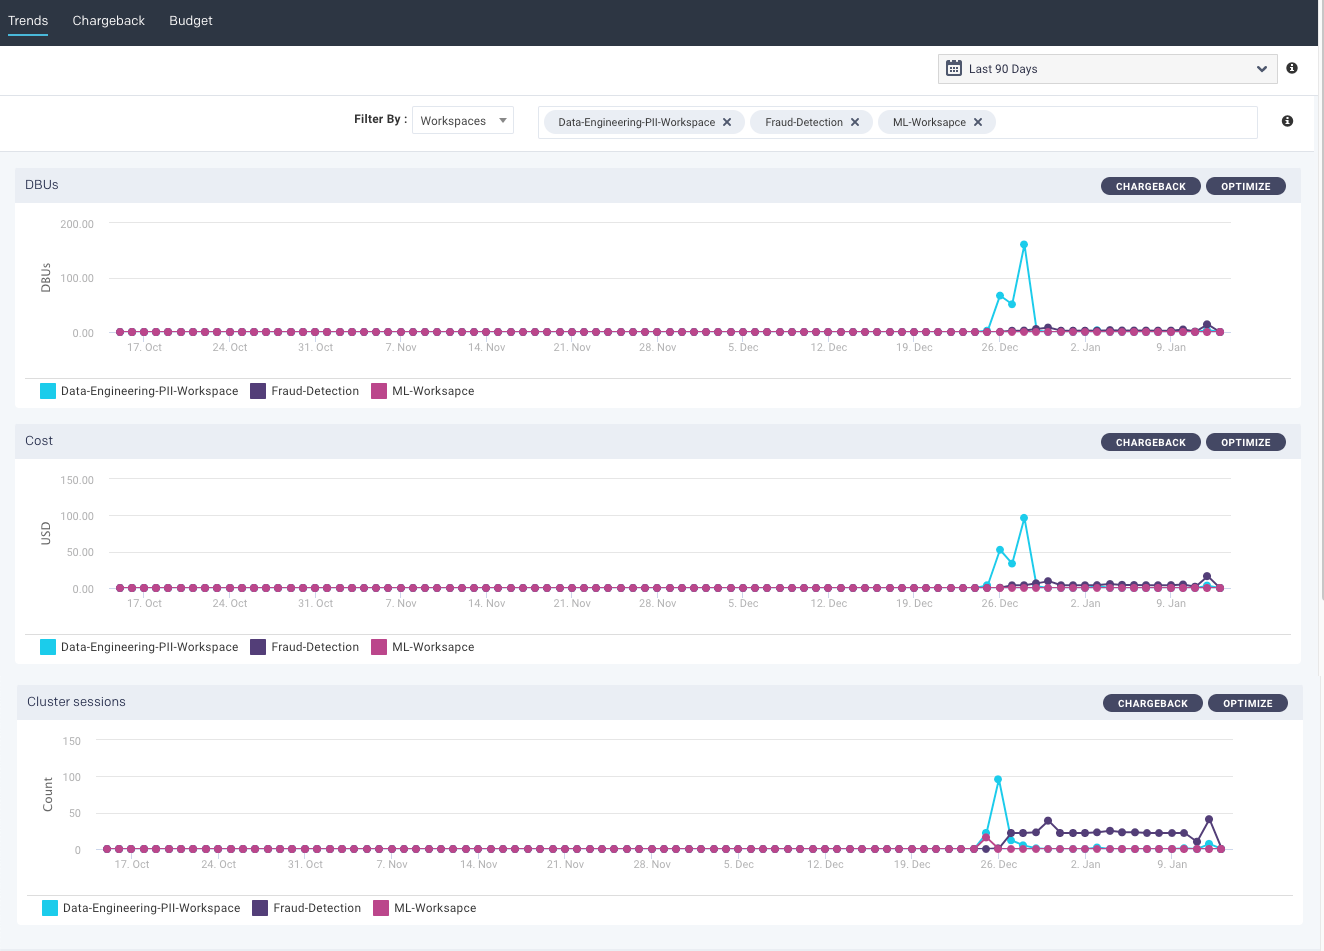
Cost Trends (Databricks)
Note
This tab is visible only for Databricks clusters.
You can view the trends of DBUs, cost (in $), and the number of clusters for the total usage from the Cost Trends page. These trends help you identify periods with anomalies (for example, a sudden spike in the cost).
For each filter attribute (users, workspaces, clusters, tags), you can specify a maximum of 5 values, each of which corresponds to a separate trend in each of the graphs. This can help you compare different trends."
Note
This Cost > Trends page is accessible only by Unravel users with admin and read-only admin permissions.
Viewing the cost trends
On the Unravel UI, navigate to Cost > Trends.
Click
 and select a time range to view the trend graphs. You can choose any of the preset time ranges (Last 7 days, Last 14 days, Last 30 days) or select a custom time range, which can be between 1 day (min) and 90 days (max).
From the Filter By dropdown, select one of the following filter attributes to view the trend graphs:
Workspace (default)
User
Clusters
Tags
A tag comprises a key and a value. You must specify both the key and the value for each tag.
Note
Workspace, User, Cluster, and Tag all have Any as the default value. This value indicates that no filters are applied and shows the total unfiltered cost of all clusters tracked by Unravel during the selected time range for each trend graph in a single line.
You can specify one or more values for the selected filter attribute from the adjacent dropdown. For example, if you have selected the User filter earlier, you can choose user1, user2, user3, etc. You can select a maximum of up to 5 such actual user values.
The UI displays the trend graphs for the DBUs, cost, and for the number of cluster sessions for the selected filters. If you have chosen multiple Filter by values, all those values are represented by different trend lines. Click
 next to the option to deselect an option.
Click the
 button on the upper right of the trend graphs to view the selected context. This includes the selected filter and the period.
 Click the
 button on the upper right of the trend graphs to check the list of jobs for the selected period and optimize cost and performance.
Notice
For the cost, you can filter by an attribute. For each of such attributes, you can specify multiple values. Unravel evaluates these values using the OR semantics. For example, if you filter by user attribute, you may select user A and user B. The results shown belong either to User A or to User B.
For jobs, this behavior is different. You can filter by multiple attributes at the same time. For example, you may specify a workspace attribute and later a user attribute. Unravel evaluates those attributes using the AND semantics. However, within each attribute, you can specify multiple values. For instance, you may select User A and User B for the user attribute. Those are values evaluated using the OR semantics.