Catalog report
A report of all apps and tables and their lineage relationships (input tables, output tables, etc.). You can create this report either from the UI or the command line. Using this report, you can analyze data from MR, Hive, Spark, and Impala applications.
Click Generate Reports > New button.
In the New Report dialog box, enter the following details.
Items
Description
General
Name
Name of the report.
Environment
Select your platform. The reports corresponding to the selected platform are only listed in the Report type. If you select the All option, all the reports are listed.
Report type
Type of report. Select Catalog Report.
Schedule
Select the checkbox to schedule the report to run daily, hourly, weekly, or monthly. You can also set the schedule can using a cron expression. You can expand the Example drop-down and select the corresponding options. The next four sample run times are displayed for reference.
Retention
The number of days to retain the report files. All the reports are stored in the
unity-one/src/assets/reports/jobsdirectory. After completion of the retention period, the report files are automatically purged.Parameters
Reports
Select a report.
Application Kind
Select the type of application. Options are Impala, Hive, Spark, and MR.
Look Back
The period range in days when applications can be selected for report generation. A notification is displayed above this option that informs about the duration when data is available for the report.
Use Exact Date-Time
Check this option and select the from and to dates to schedule the report for the exact time range specified. The only anomaly with this option is that the same report will be scheduled to be generated repeatedly.
Users
Select the users who must be included in the report. You can select multiple users. If not selected, all the users will be considered in the report.
Queues
Select the queues that you want to be included in the report. You can select multiple queues. If not selected, all the queues will be considered in the report.
Clusters
Select the clusters that you want to be included in the report. You can select multiple clusters. If not selected, all the clusters will be considered in the report.
Tag Names
Select the tag names that you want to be included in the report. You can select multiple tag names. If not selected, all the tag names will be considered in the report.
Tag Values
Select the tag values corresponding to the tag names you have selected that you want to include in the report. Options for tag values will only show when you select a tag. You can choose multiple tag values. If none are selected, all tag values detected for a tag will be included in the report.
TopK
Specify the TopK criteria or the number of applications that you want to be included in the report.
Top K options
Specify the TopK options (IO, Memory Seconds, CPU Time, Duration, Cost) in which you want to view the list of TopK apps.
Features Filter
Specify the Key-Value pair. You can add or remove a pair.
Notifications
Email to
Email ID to send the notification when the report is generated. You can specify multiple email IDs with comma separation. You can also select the Attach Files to Email checkbox to receive the reports as an attachment.
Advance Options
Profile Memory
Select this option if you want to generate logs that help to troubleshoot scenarios where the report takes excessive time to generate or fails to generate.
Caution
The option will increase the report run time excessively.
Click OK. The generated reports will be listed under Reports on the App UI.
Select the generated report and then click Run. After the report is successfully run, the details of the report runs are listed in the Run box on the right.
Click the following:
HTML files link to view the report details.
Input parameters link to view the parameters you chose to run the report.
Log file link to view the logs of the report.
From the terminal, change directories to
unity-one/srcdirectory.cd /opt/unravel/data/apps/unity-one/src
Use a screen editor, such as vi editor, to edit the
job.jsonfile and copy-paste the following text into the file.{ "enabled": false, "retention_days": 10, "report_type": "catalog", "params": { "kind": "hive", "start_date": null, "end_date": null, "days": 300, "reports": [ "app_dependencies", "app_catalog" ], "topk": 20, "topk_options": [ "io", "memorySeconds", "cpuTime", "duration" ] }, "notifications": {} }Parameters
Description
kind
The type of data. For example, Hive, Impala, Spark etc.
start_date
Can be null or a valid start date in YYYYMMDD format.
end_date
Can be null or a valid start date.
days
The number of days to look back while downloading data.
topk
The number of applications to be shown in the report.
topk_options
An array of options for TopK.
Save and exit the screen editor.
Run the following command to generate the report:
./unity-cli.sh report generate job.json catalog report true
The Catalog report is generated based on the options selected when creating the report. The following report types are displayed.
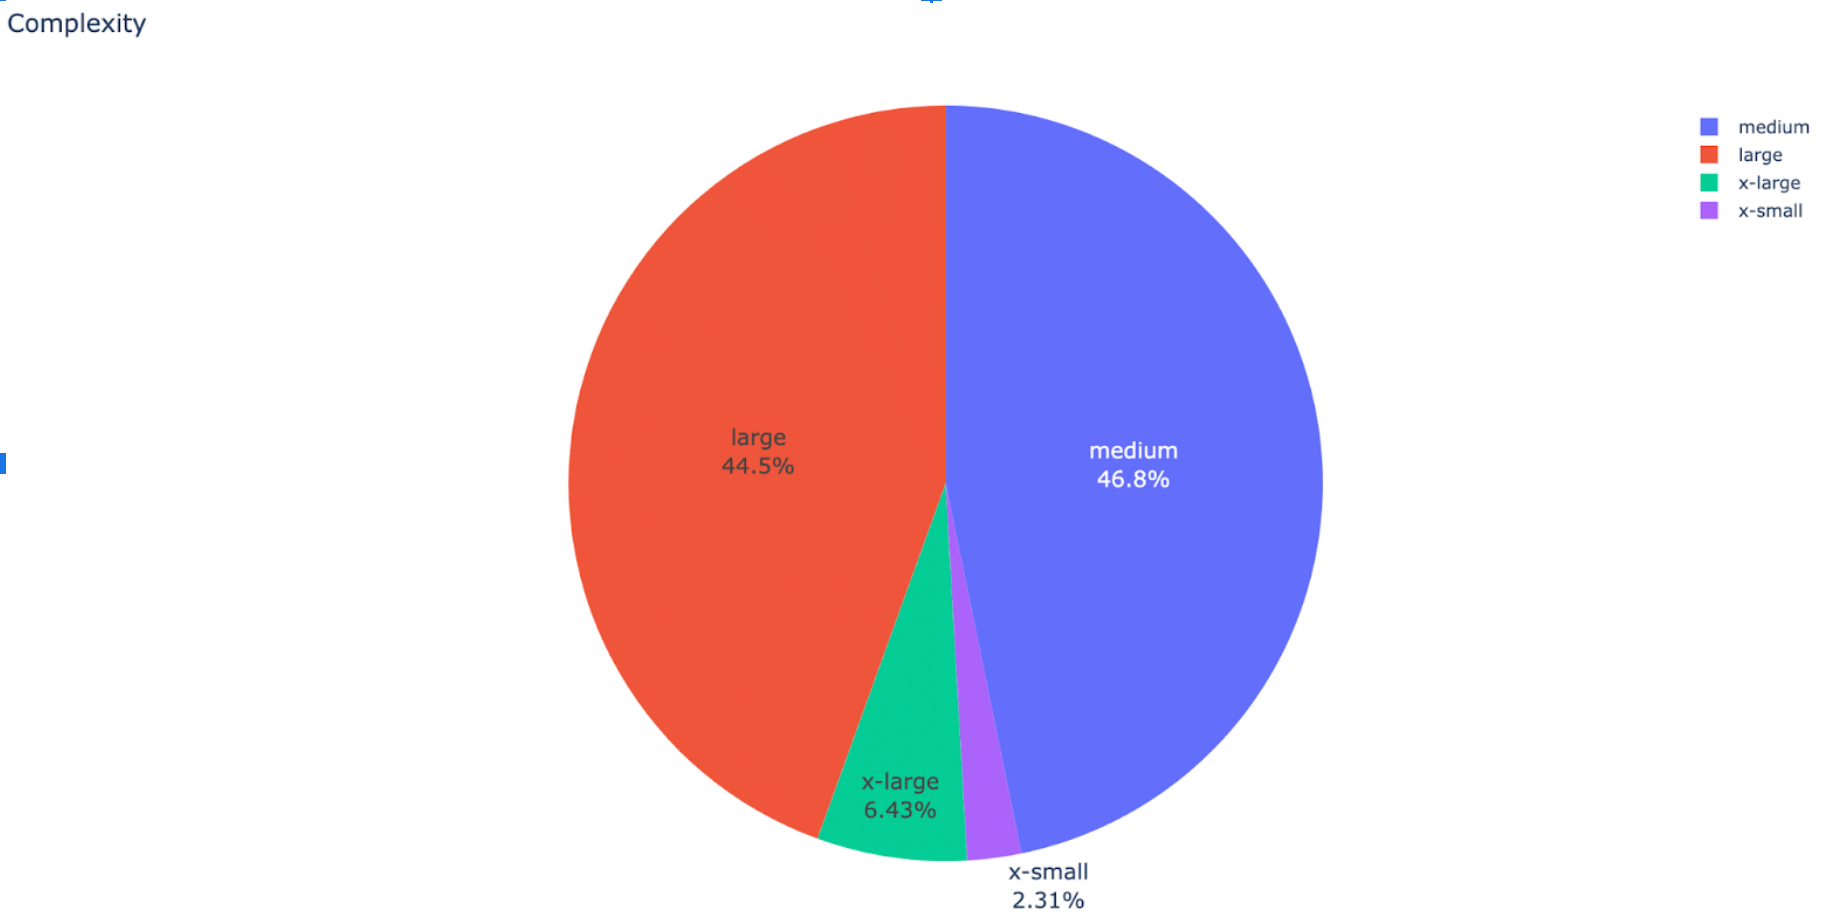
Complexity Analysis Pie chart
Shows the distribution of queries in different categories of complexity. The complexity of a query is defined by the number of joins, unions, groupby, etc. in a query. The more the number of joins, unions, etc. in the query, the higher the complexity level is assigned. The above graph represents the query complexity in percentage.
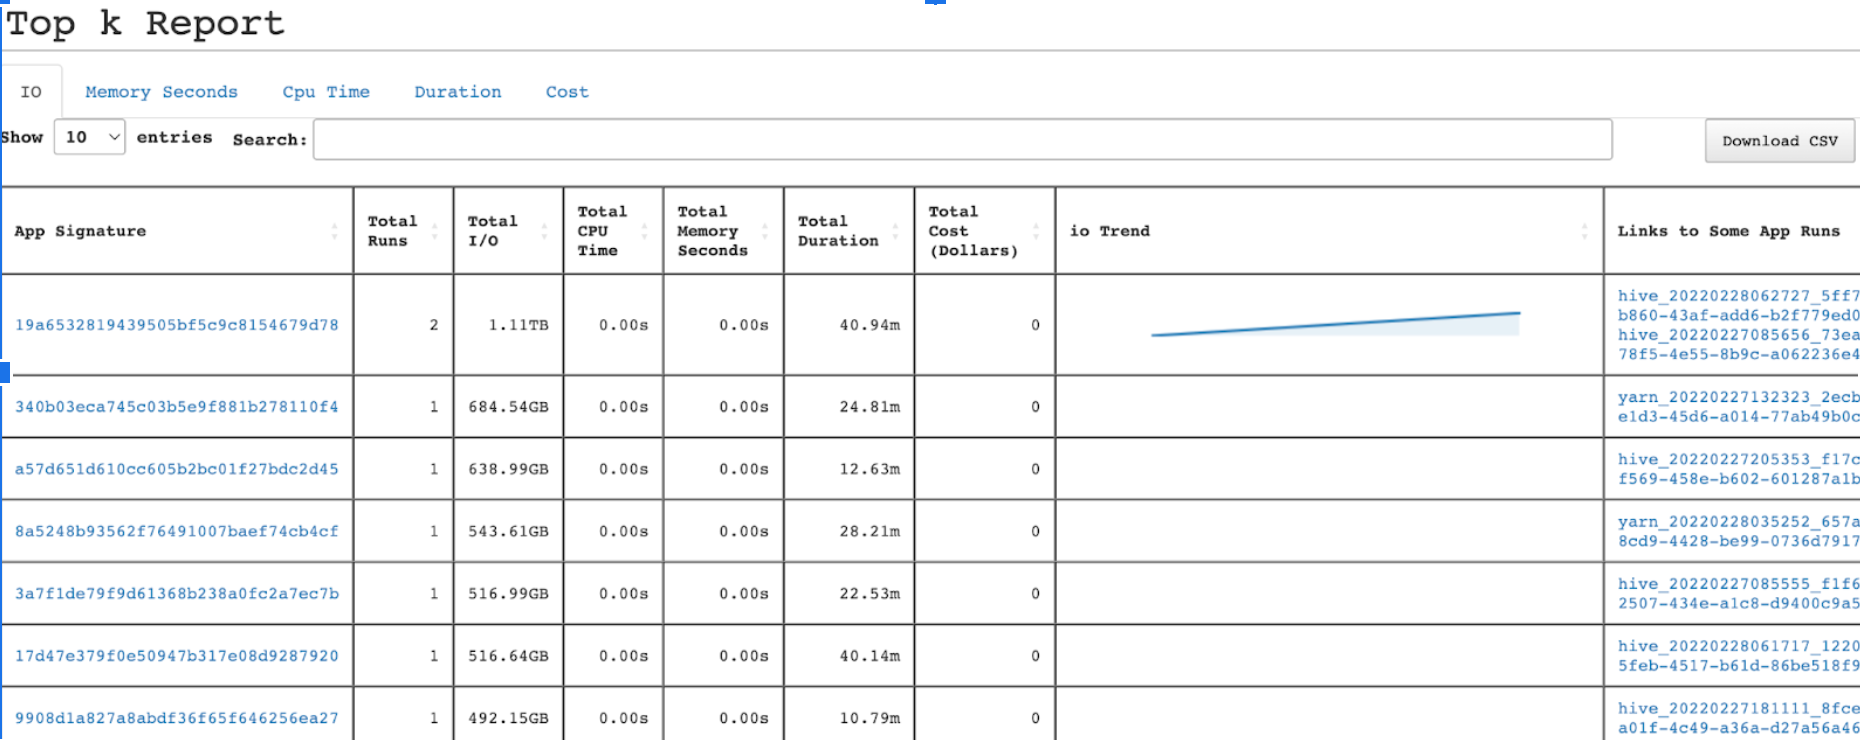
Summary report
The summary report contains the complexity pie chart and TopK apps based on different criteria along with app signature, total runs, etc.
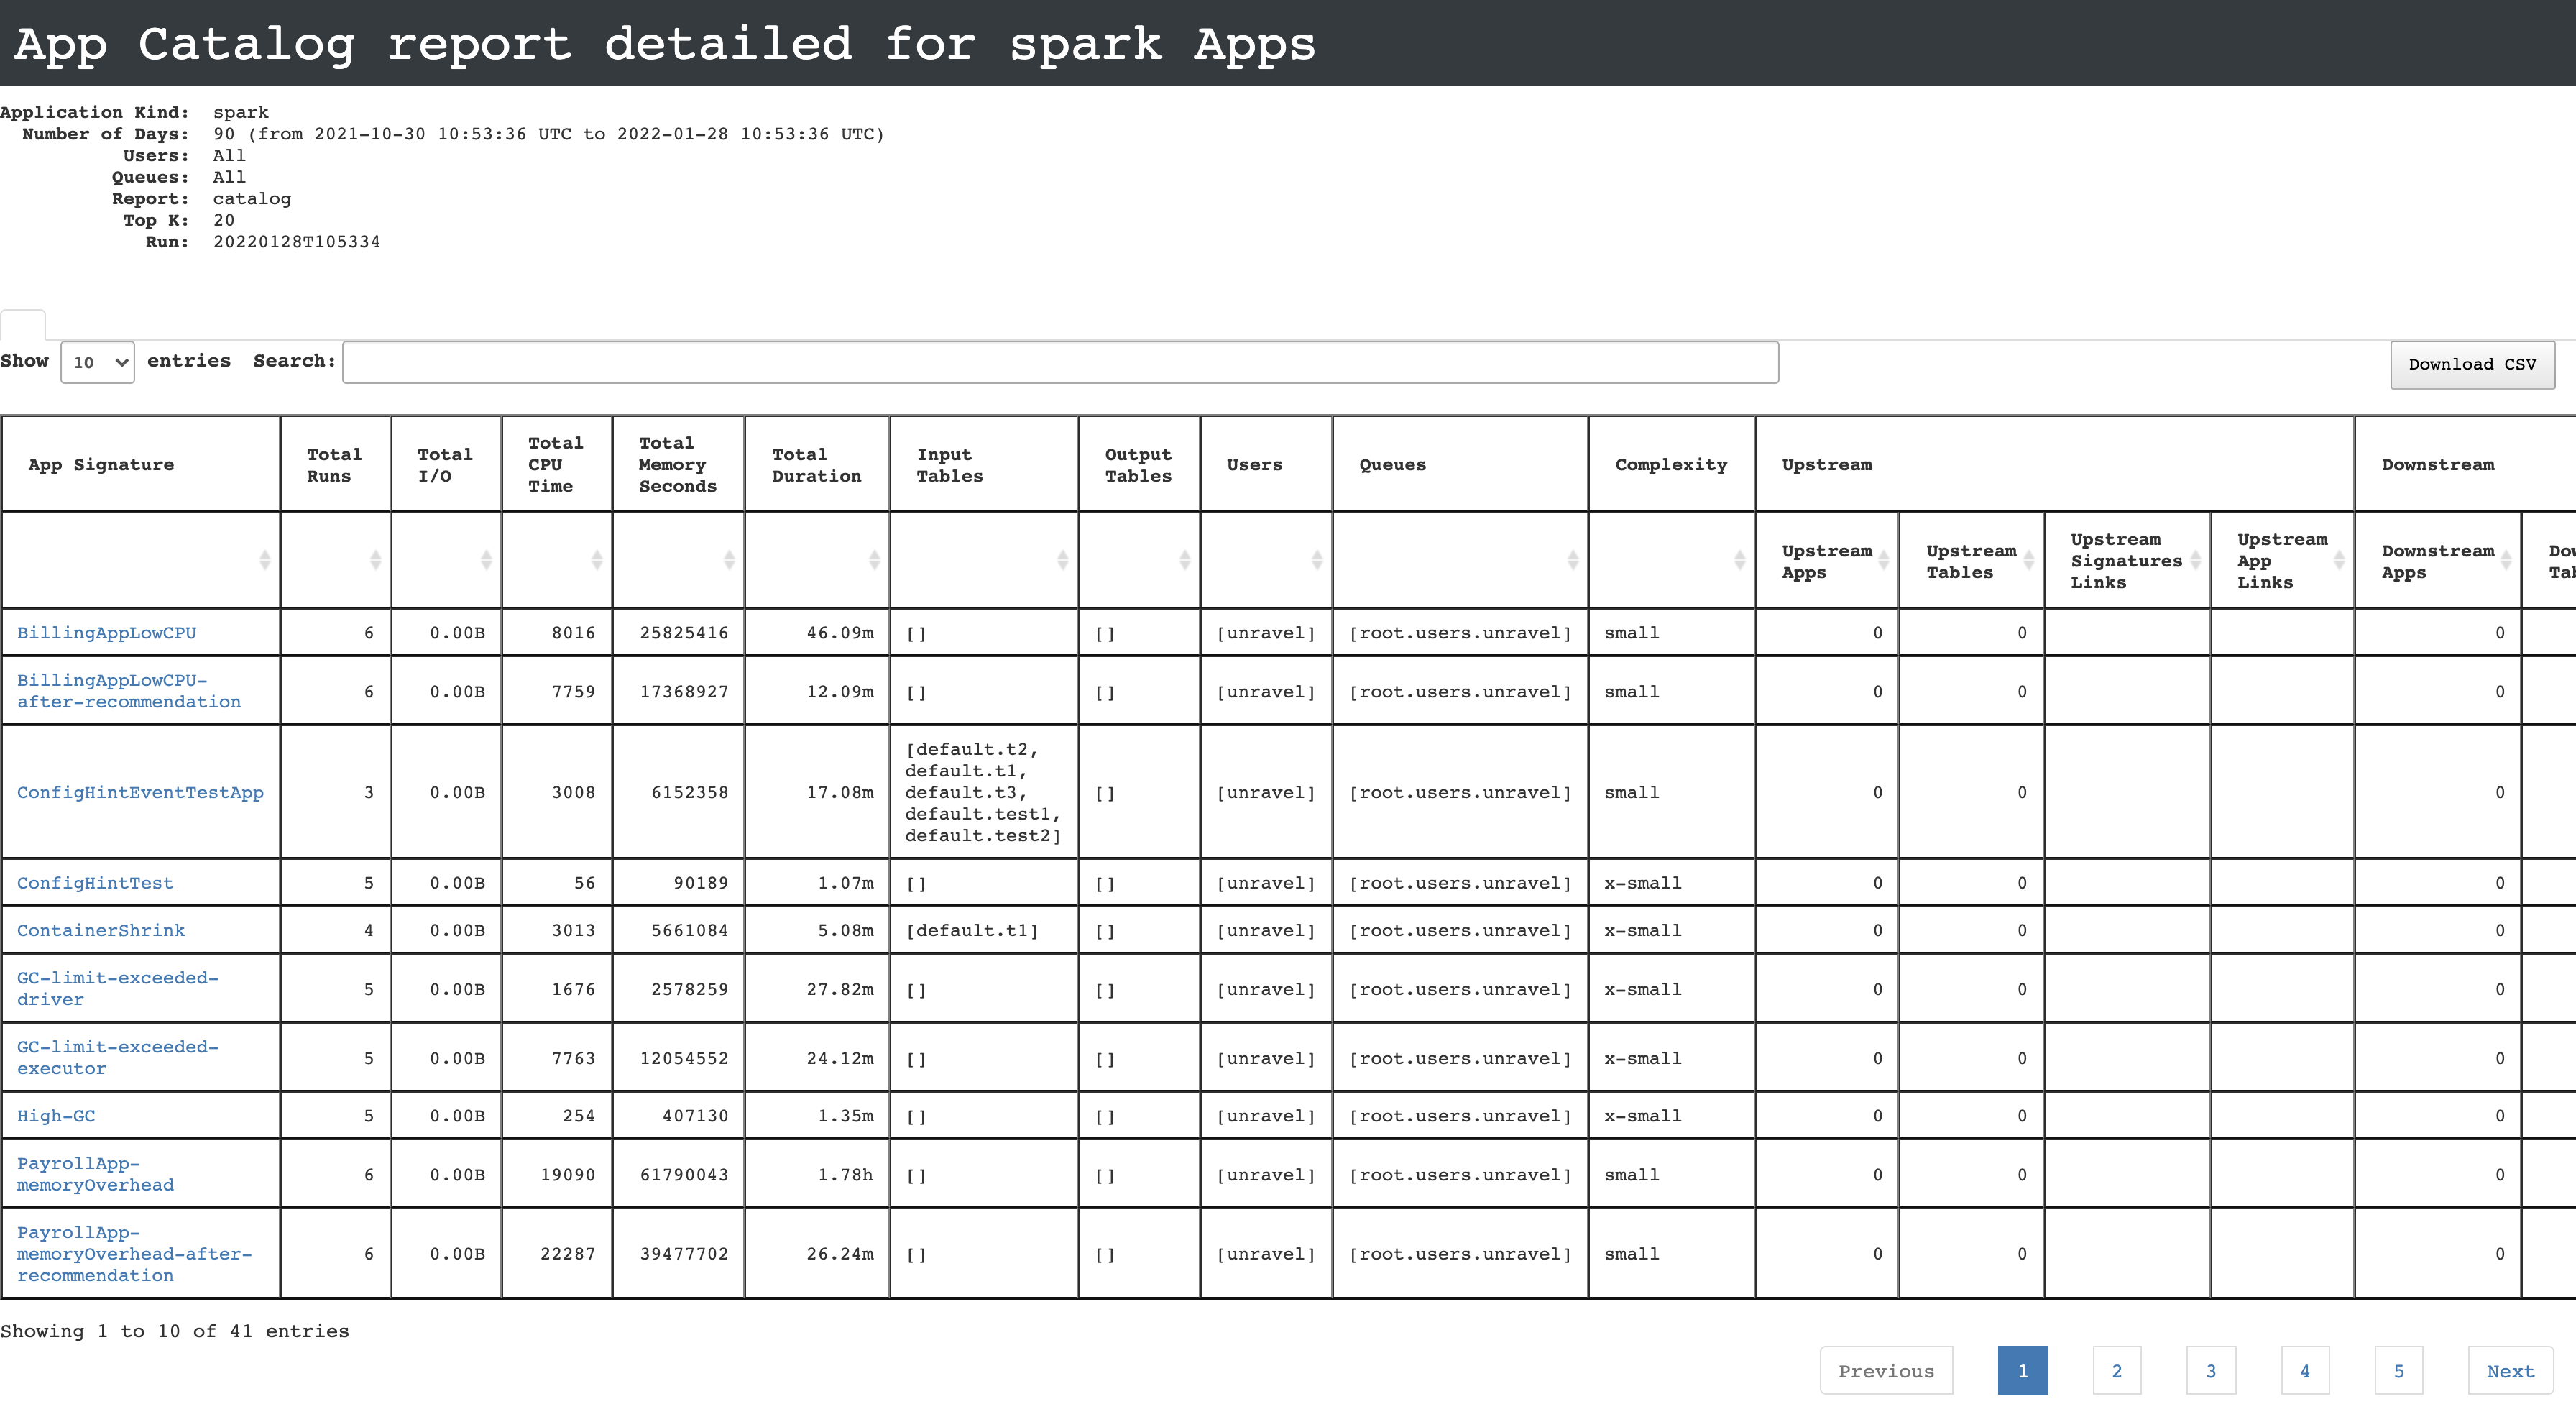
Detailed report
The detailed report contains information from the summary report along with upstream and downstream tables.
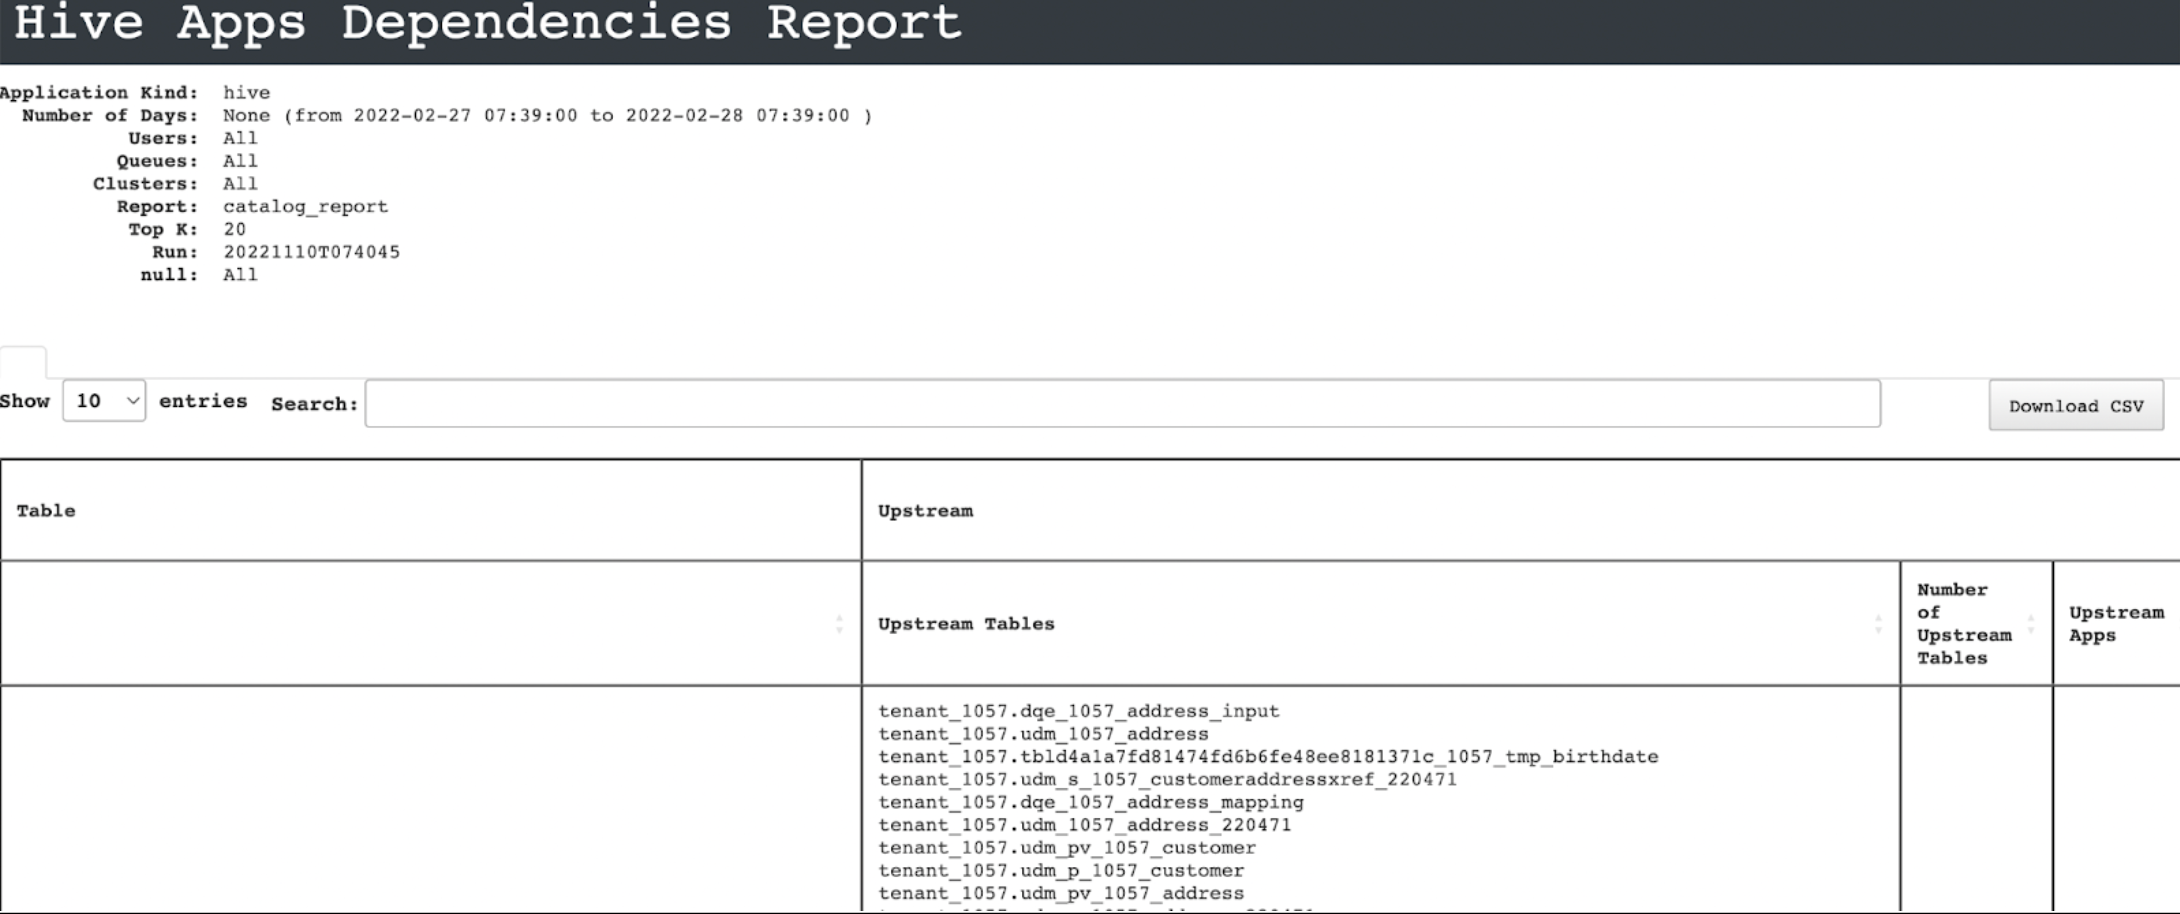
Dependency report
The dependency report shows upstream and downstream tables in detail.
Viewing metrics and insights
Open the report and click any app link from the Signature column.
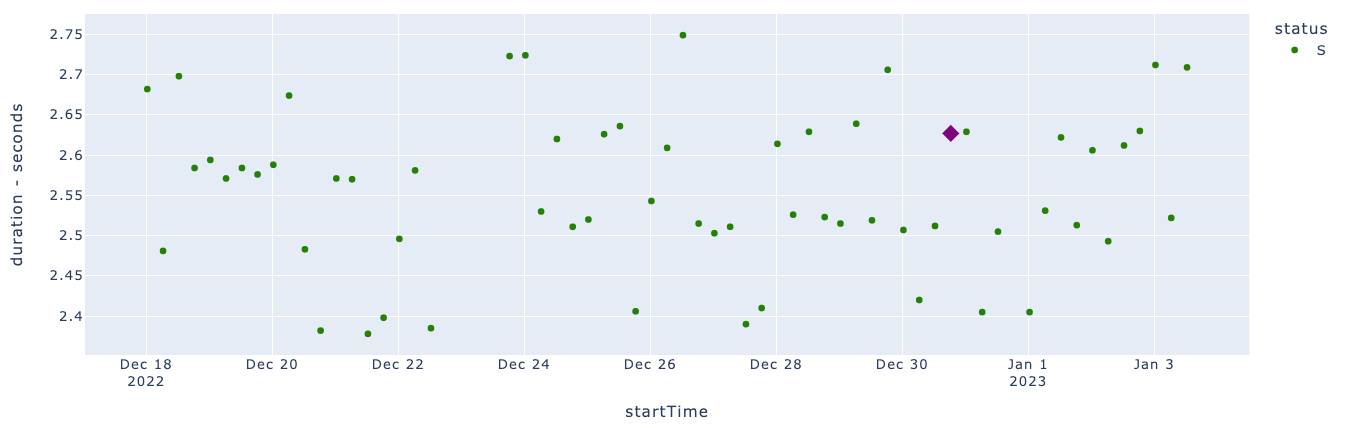
The Metrics tab displays the trend charts for the Duration, IO, MemorySeconds, and CPU metrics. The dots plotted on the trend charts are the app runs. The app info is provided in the right panel.
You can select any of the following features to view the metric trends:
status
cluster id
cluster UID
Click any dot on any of the Metric trend charts. This becomes the app target run. The details of the app target run appear in the App Run info panel on the right.
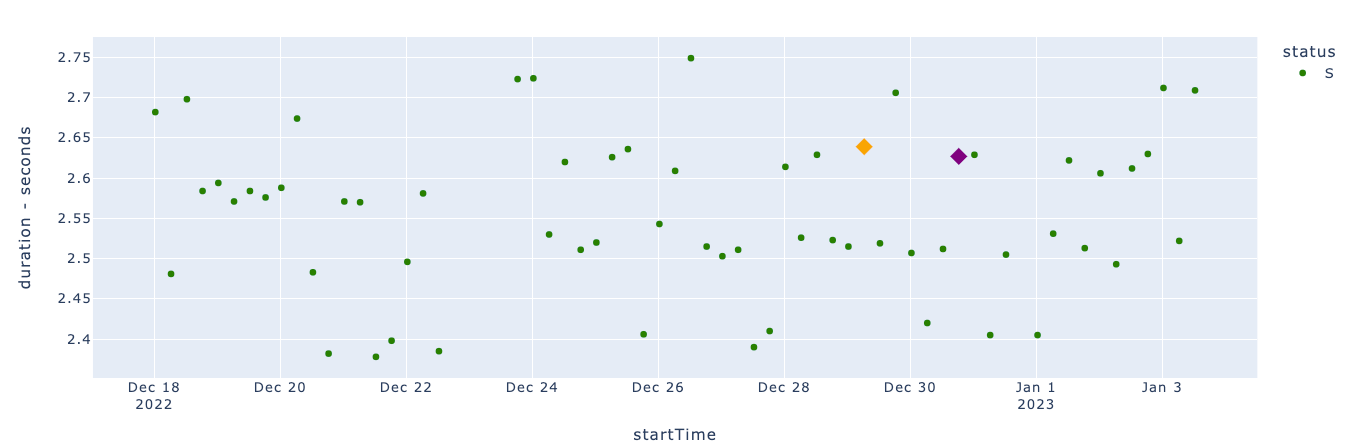
In the App Run info panel, click the ID link. This is the ID link of the app target run. The Metric tab is shown with the app target run you have chosen in a different color. The details of the app target run are displayed in the App Target Run panel on the right. Click the View in Unravel link to view the app's details in Unravel.
Select any dot (other than the dot for the app target run) on any of the Metric trend charts. This becomes the app baseline run. This is highlighted in a different color. The details of the app target run are displayed in the App Baseline Run panel on the right. Click the View in Unravel link to view the app's details in Unravel.
In the App Baseline Run panel, click Compare.
Select an app from the App Type options:
Hive on Tez
Spark
Impala
From the Cluster, select a cluster.
Specify the app runs that you want to compare.
Baseline App Run: Specify the ID of the baseline app.
Target App Run: Specify the ID of the target app with which you want to compare the baseline app.
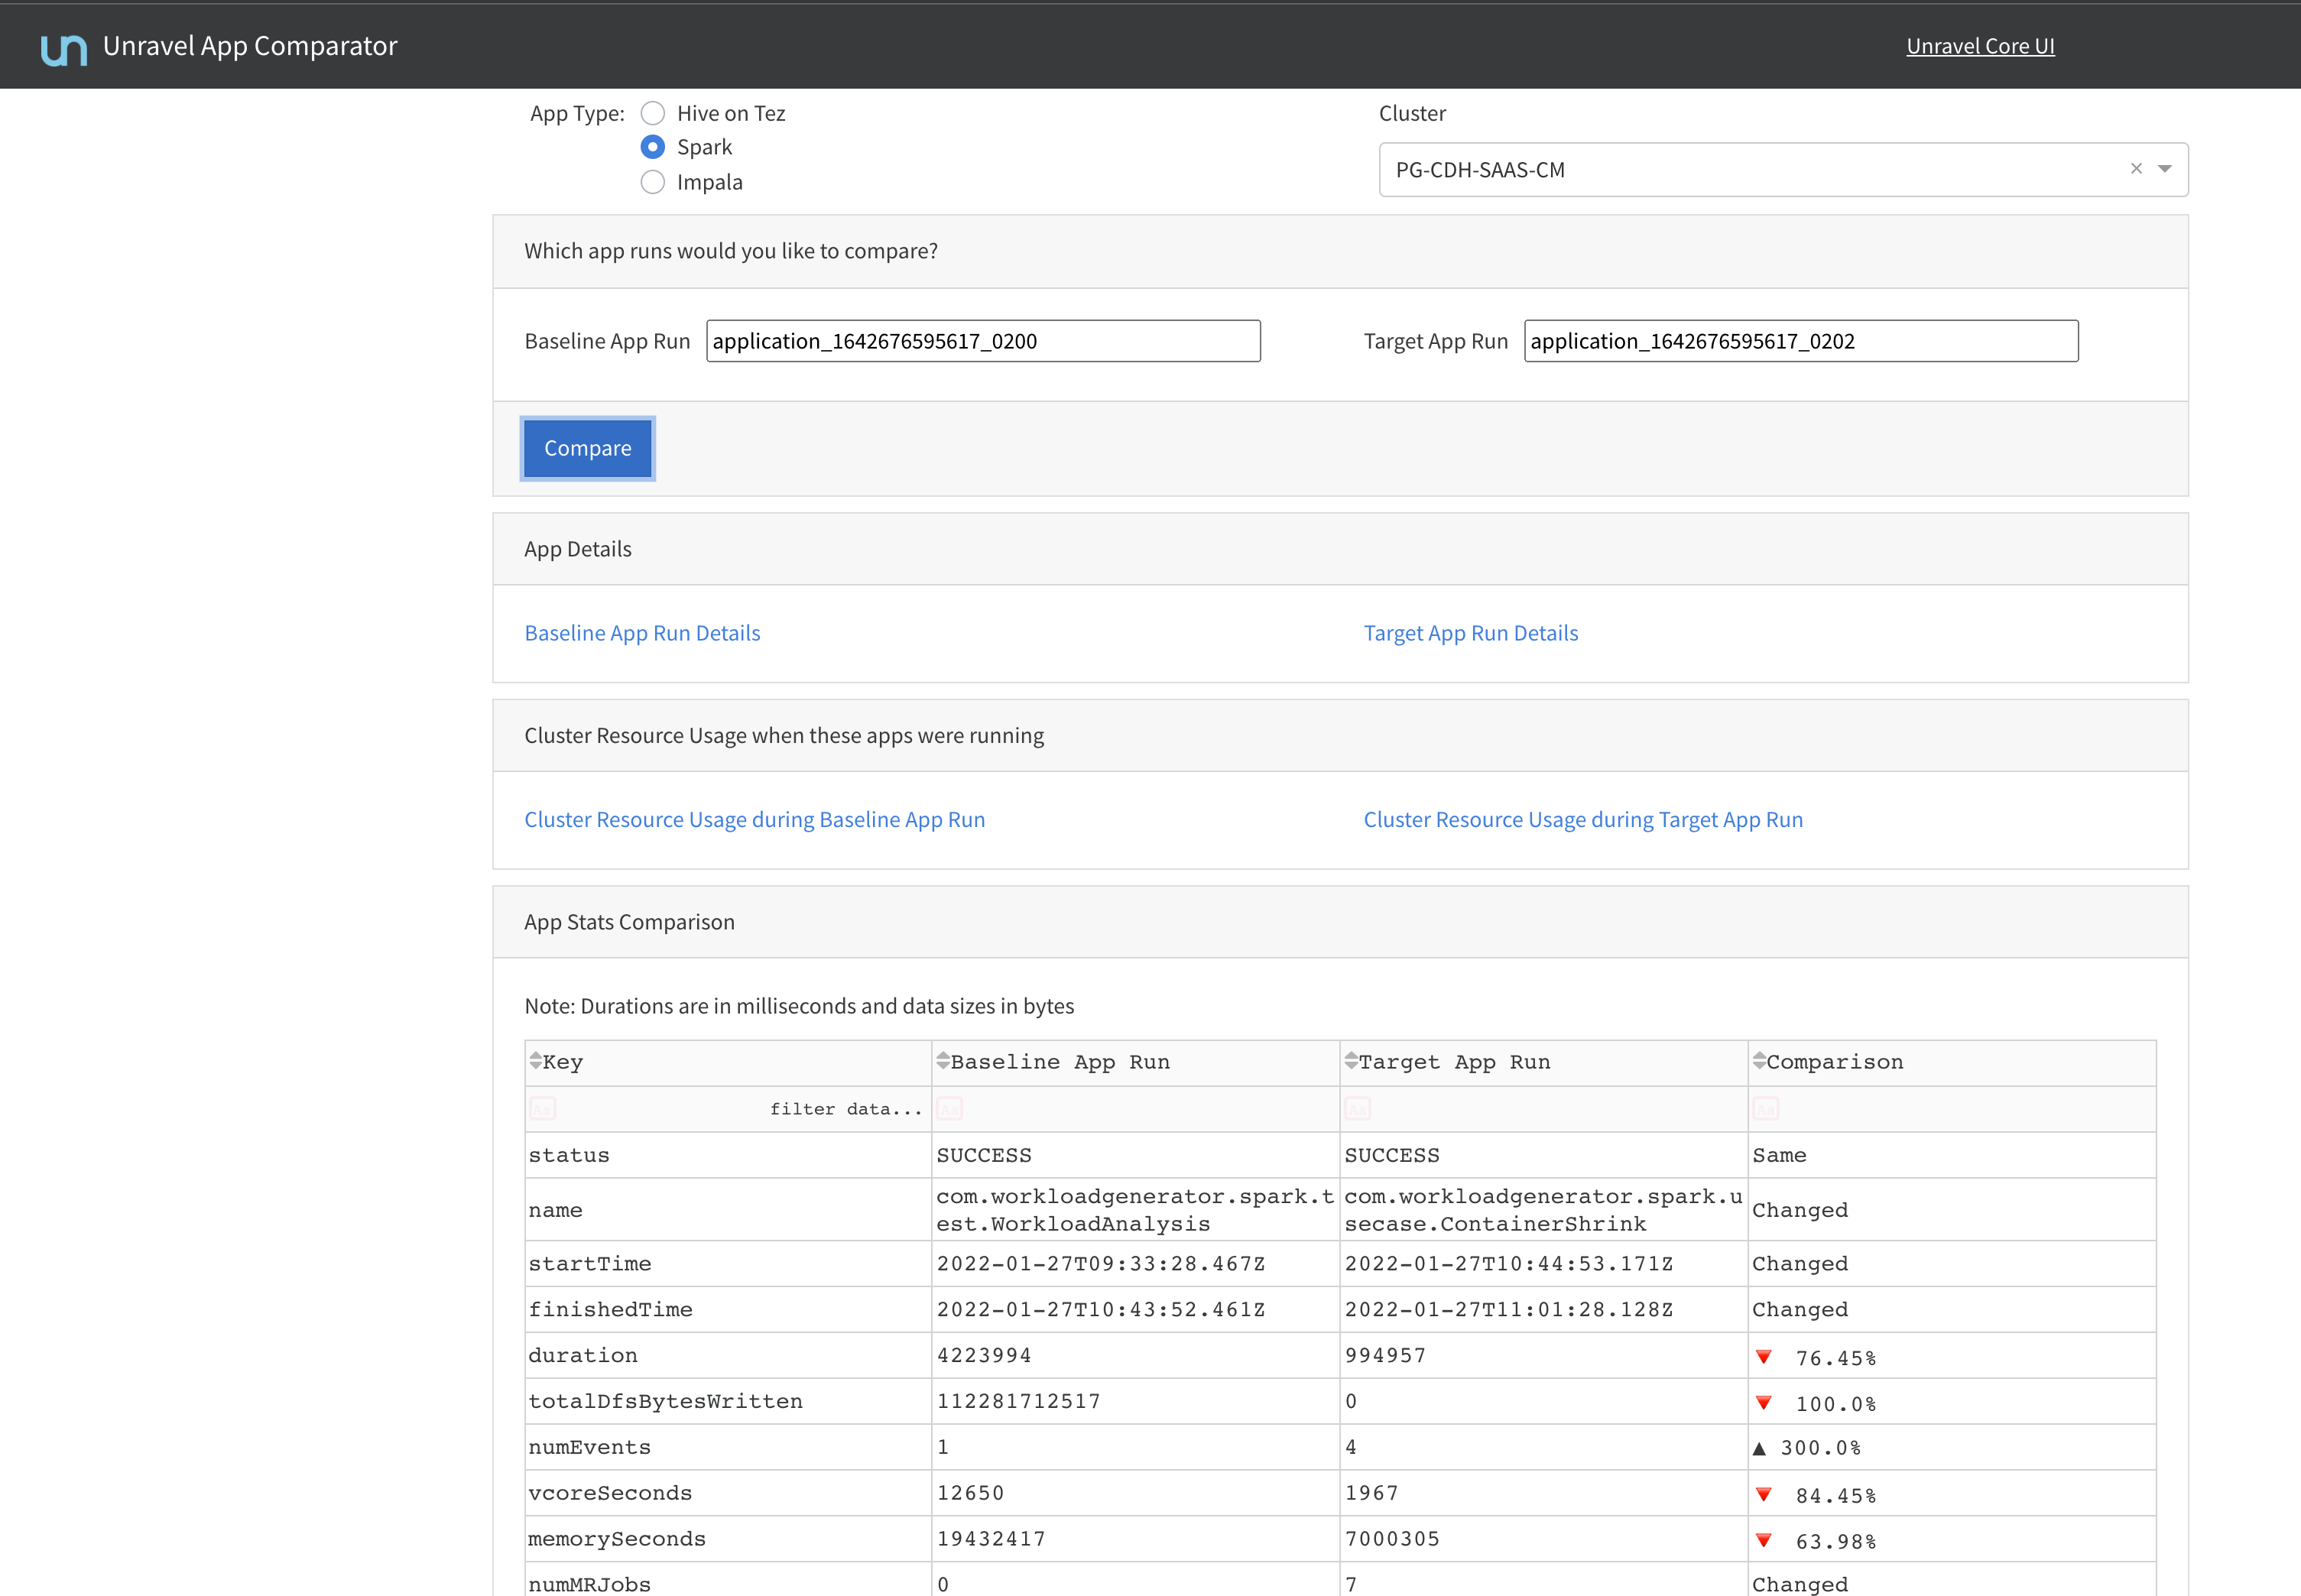
Click Compare. The following app details are given for the baseline and target app run:
App details
Cluster resource usage when these apps were running
App statistics comparison details
App config comparison details
Query string comparison details
Query plan comparison details
In the App Baseline Run panel, click Refresh Insights. The insights are provided in the following sections.
Baseline comparison
The results of the comparison are displayed.
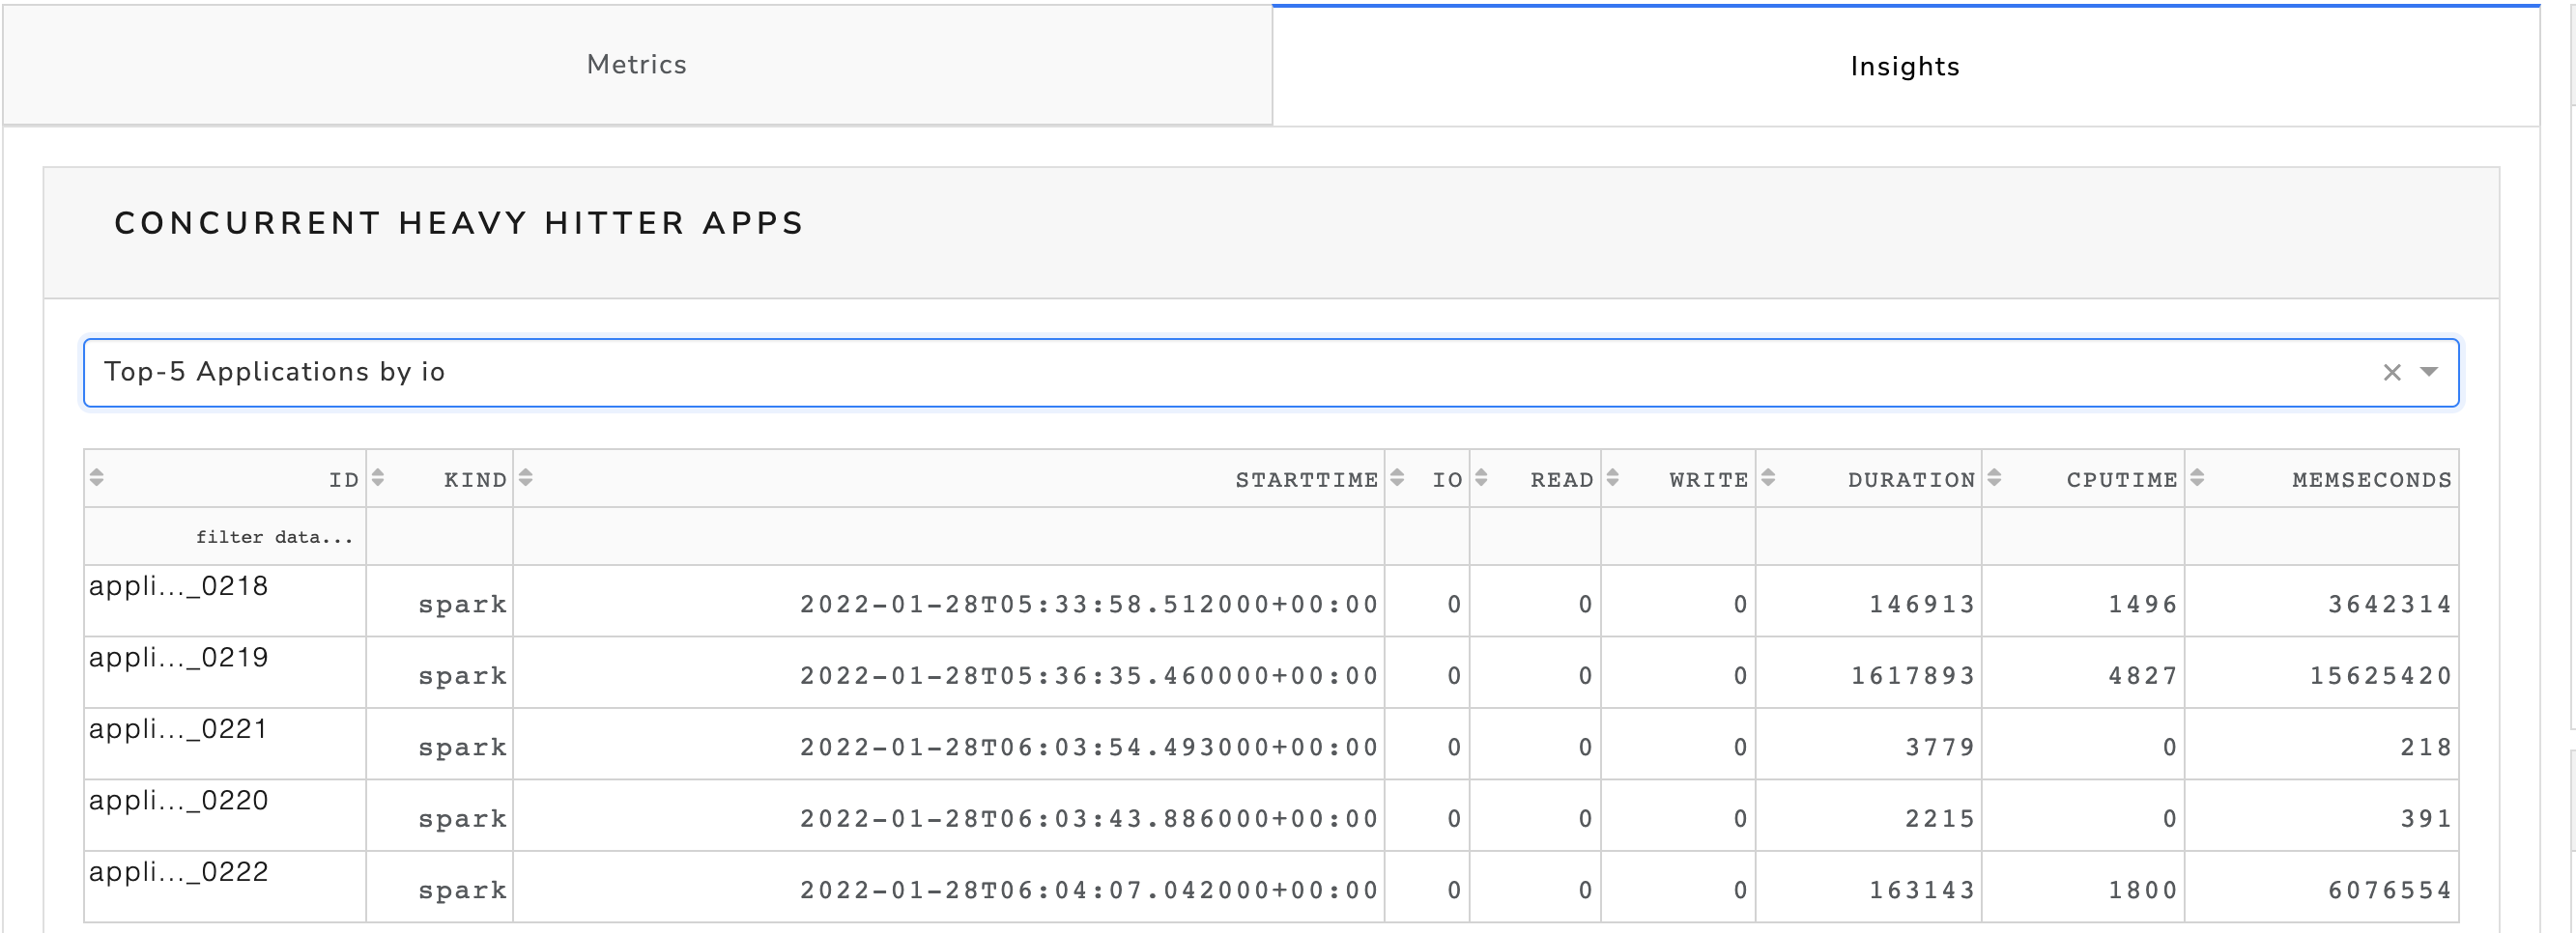
Concurrent heavy hitter apps
This section will show up only when the information is available.
Select this option to view the top five applications in a specific category.
Click the Concurrent heavy hitter apps option.
Select any option from the Top-5 Applications option.
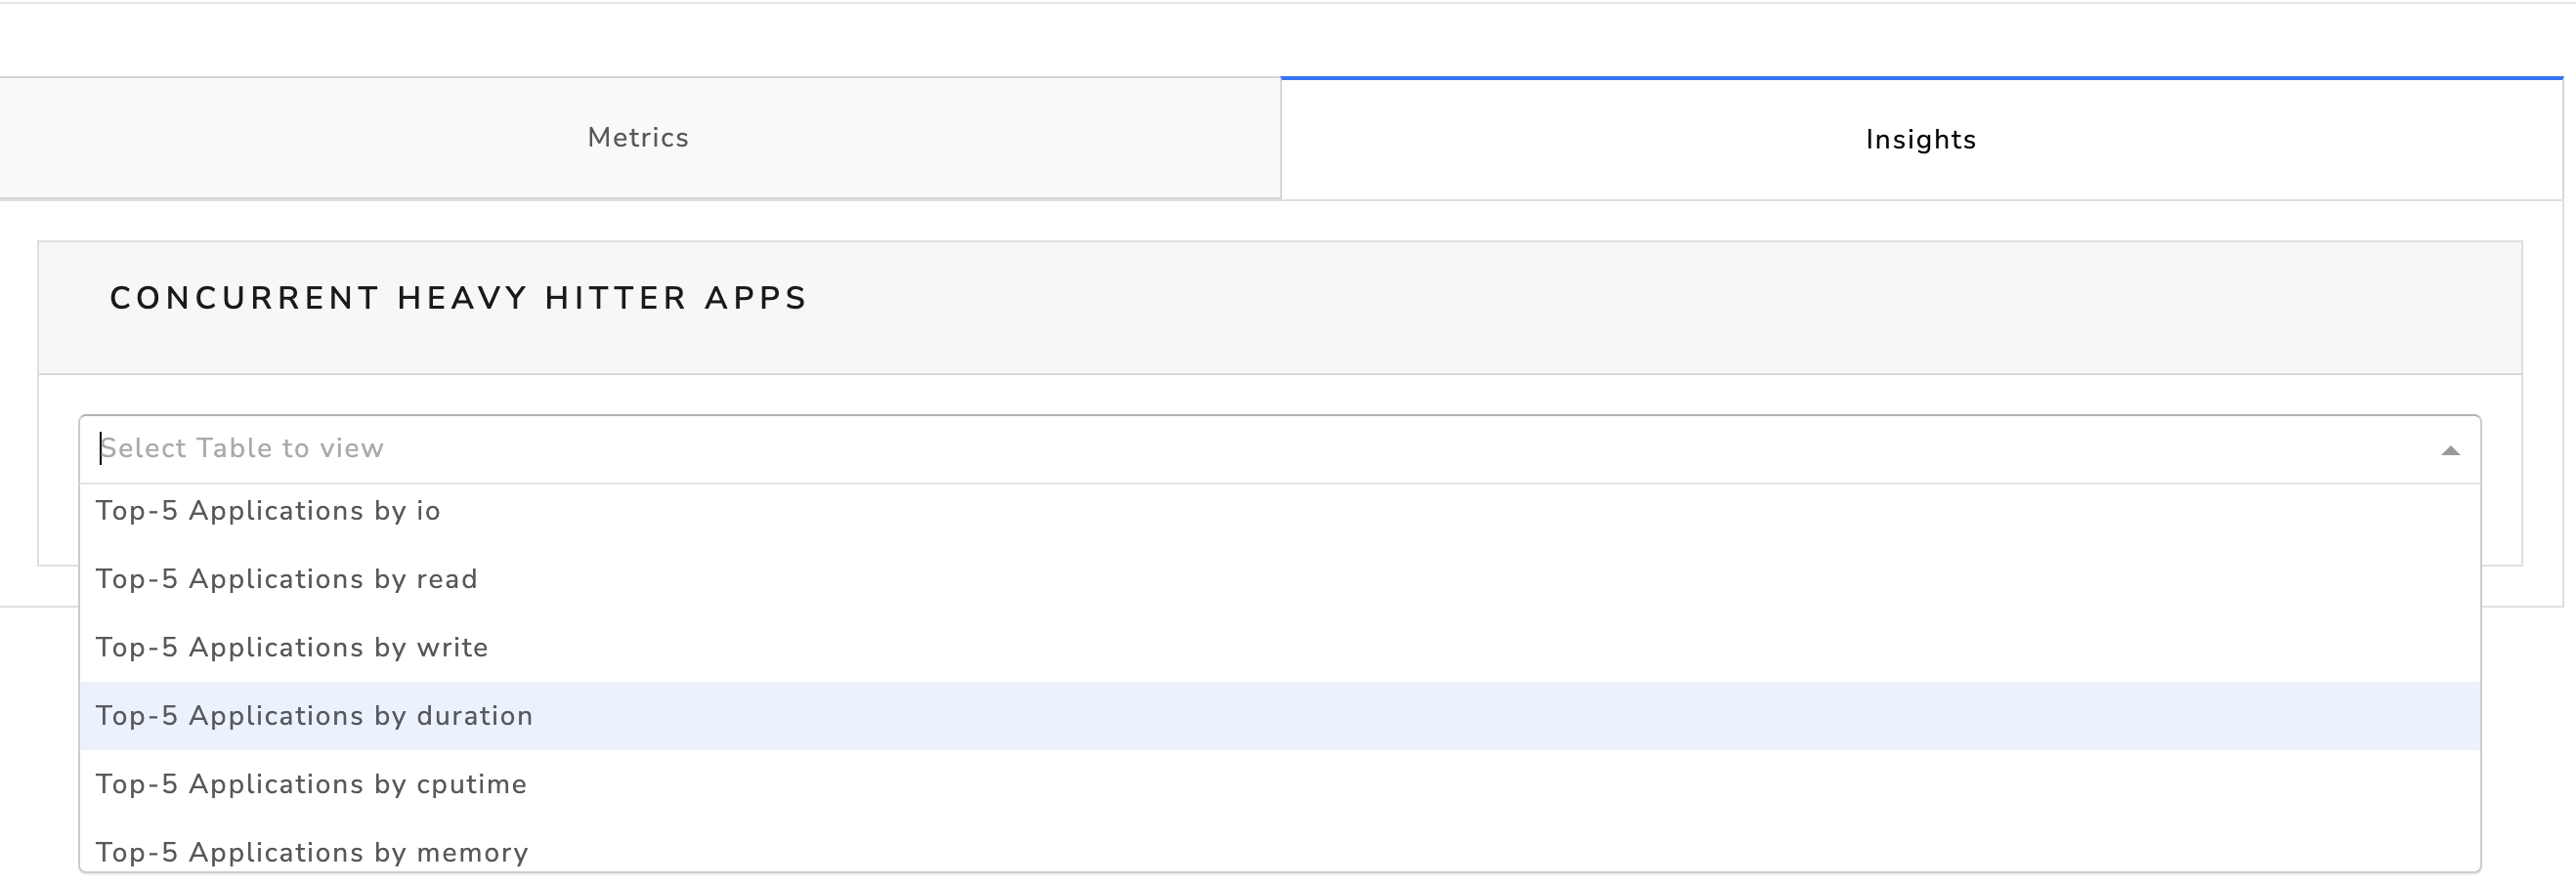
The corresponding details are displayed.